Key Stats
How many cars did Ford sell in 2024?
Ford sold 1,796,834 vehicles in 2024. In 2023, Ford sold 1,903,963 vehicles. They sold 107,129 more vehicles in year 2023 compared to 2024 with a percent loss of 5.63% YoY.
Ford Total US Sales Statistics by Year
Ford Total US Sales Statistics by Quarter
Current Lineup
Discontinued Models
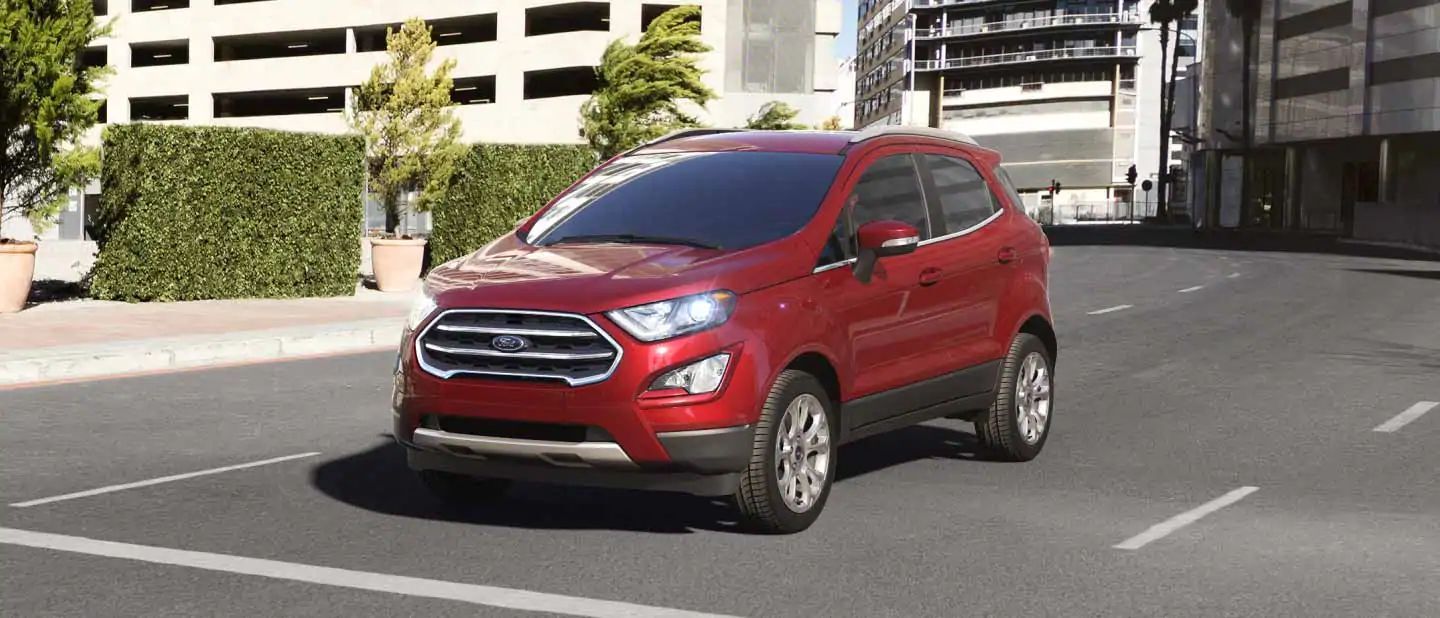
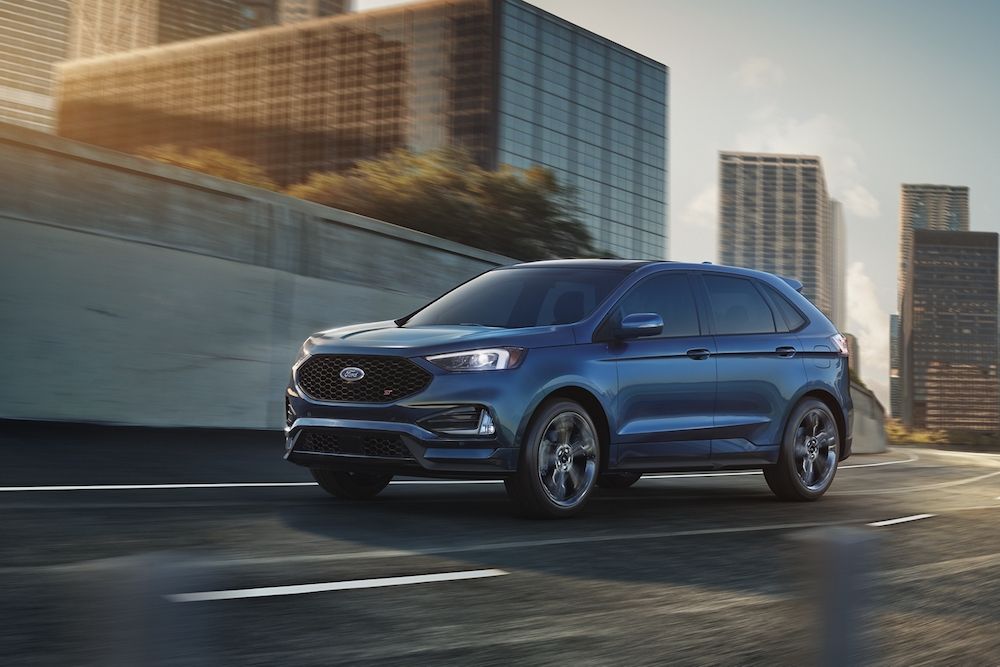
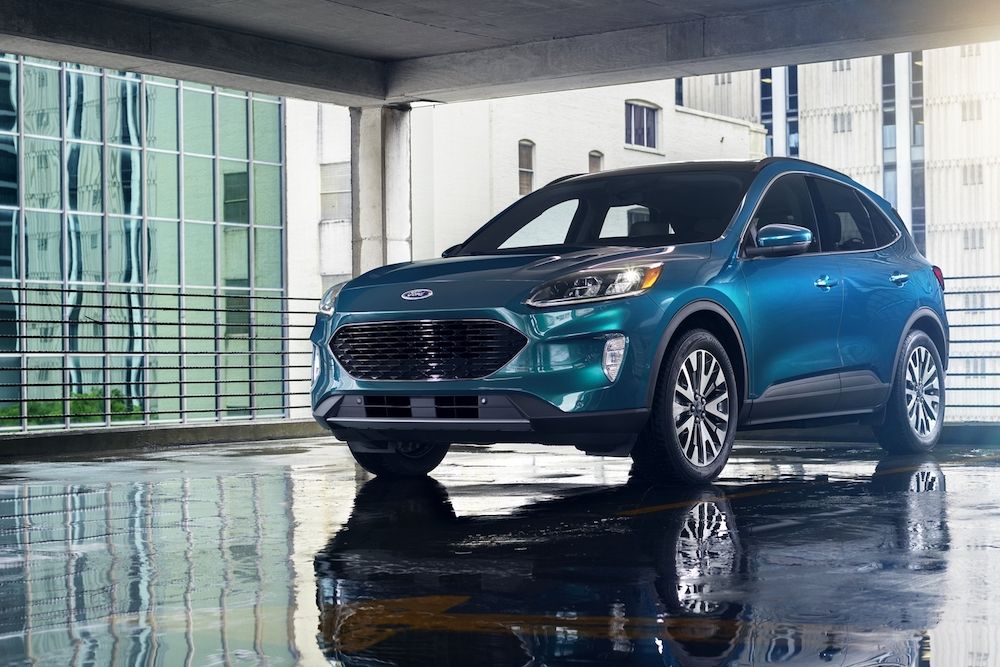
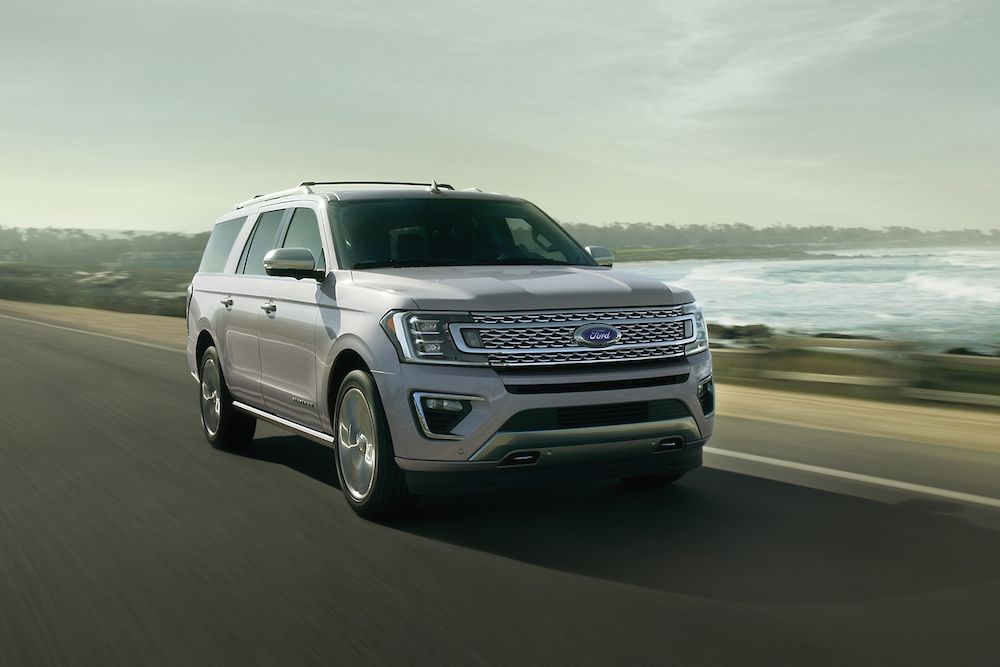
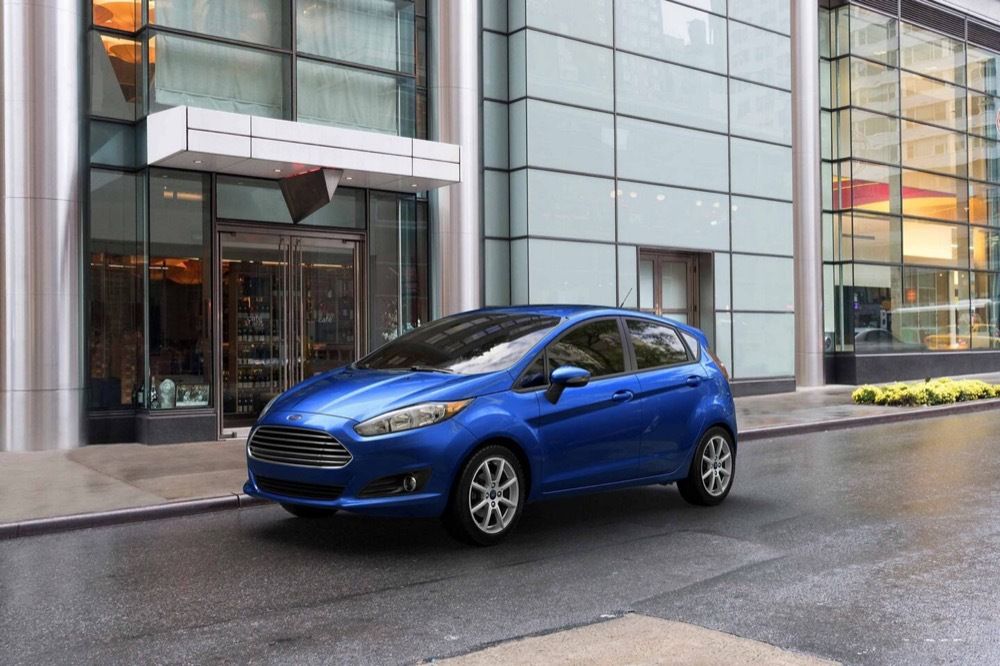
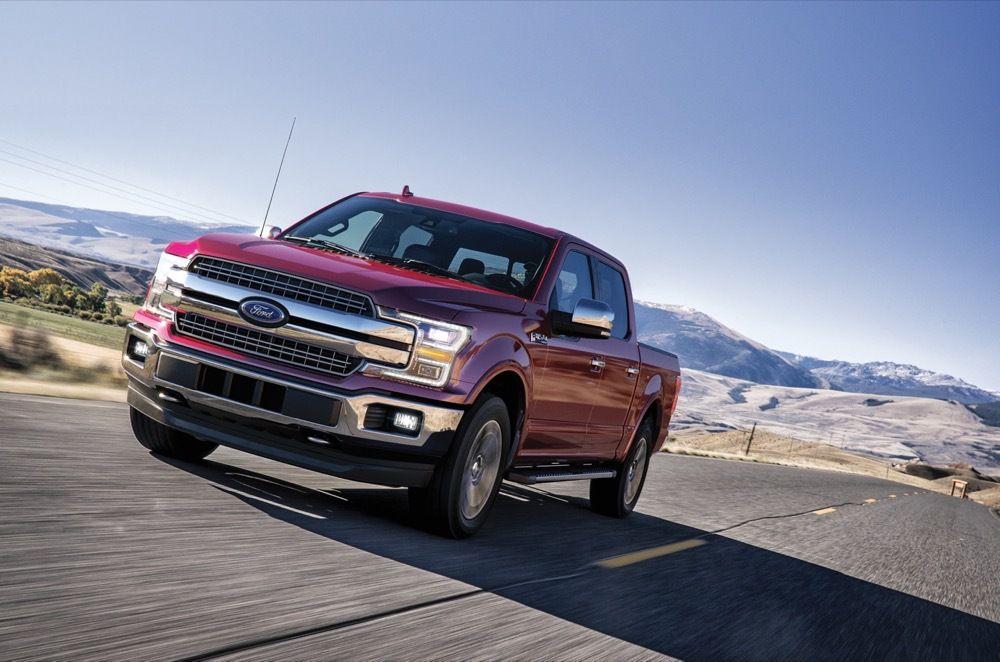
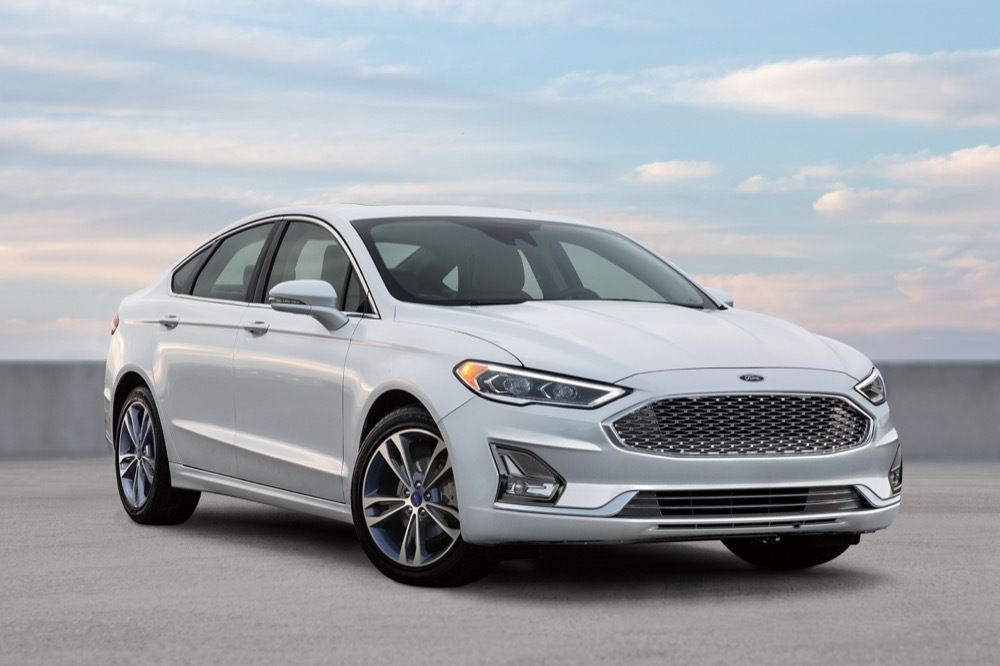
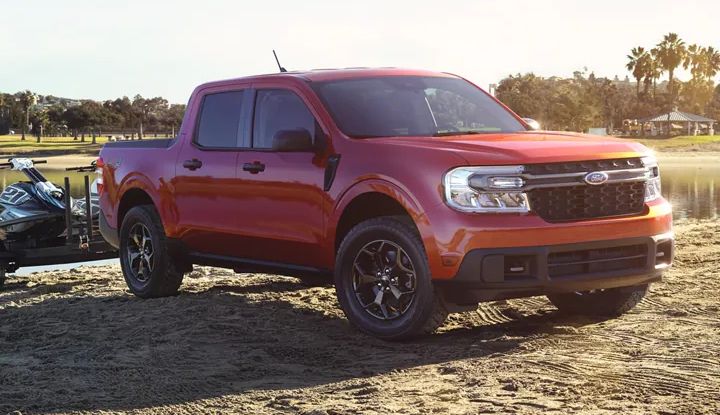
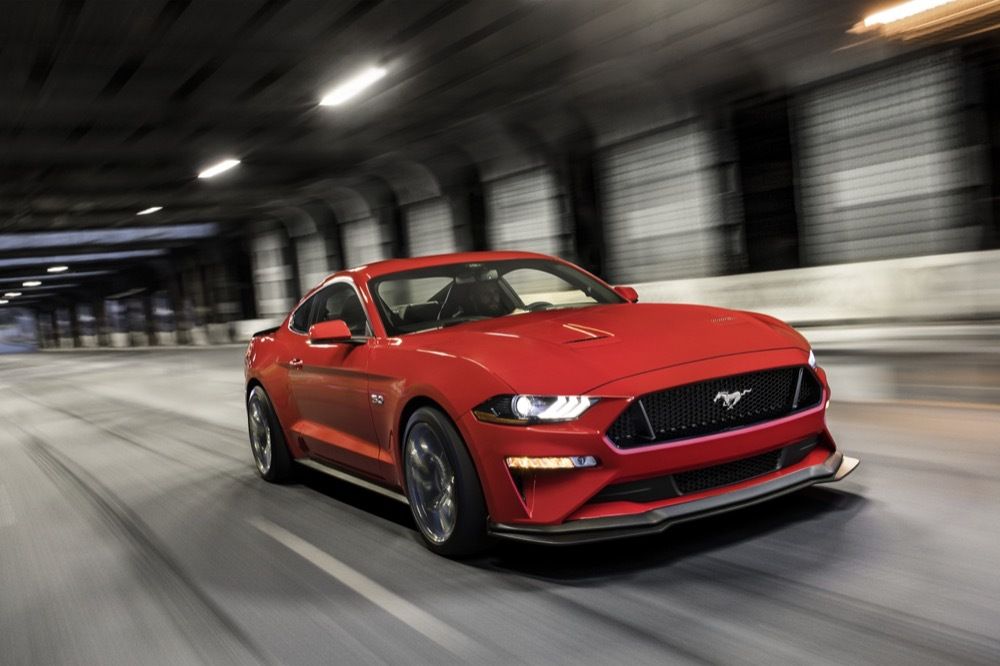
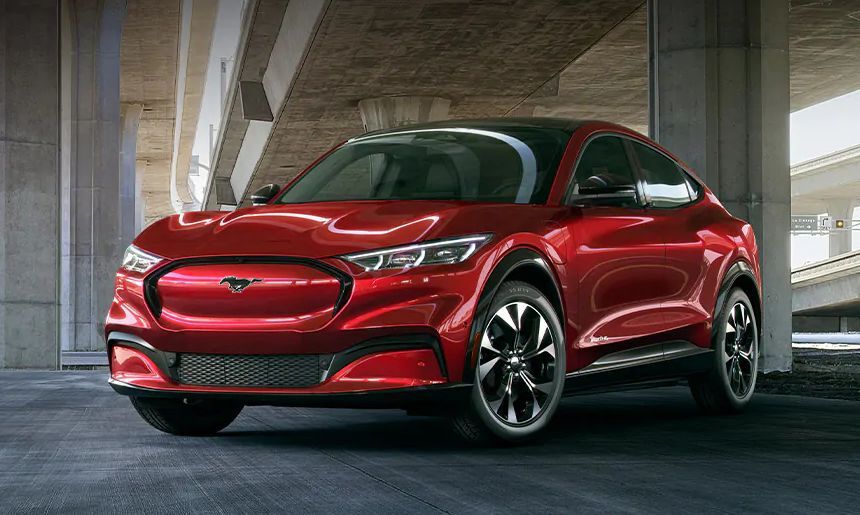
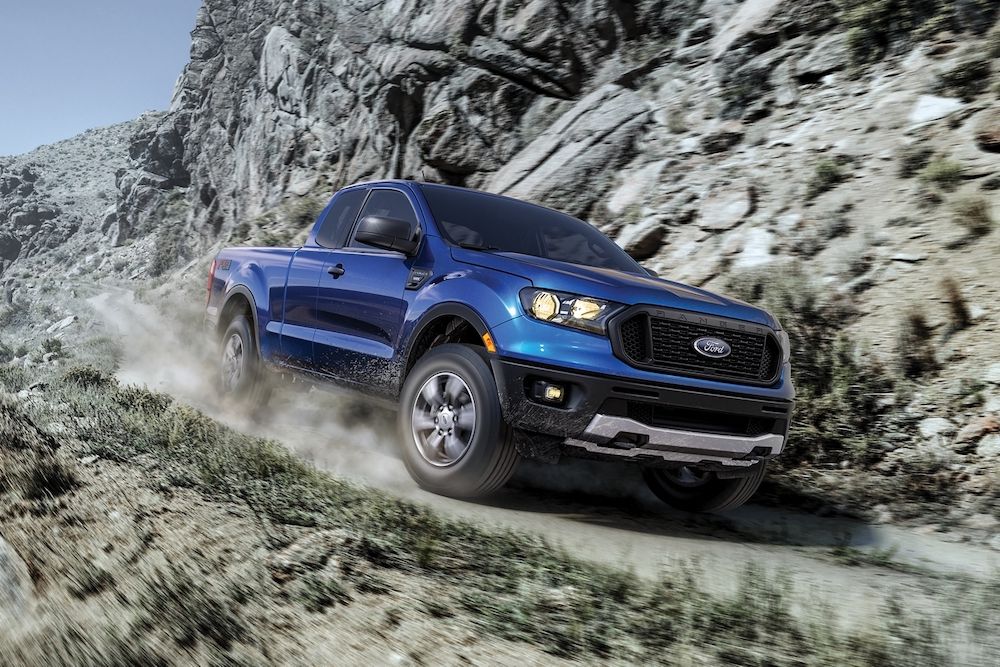
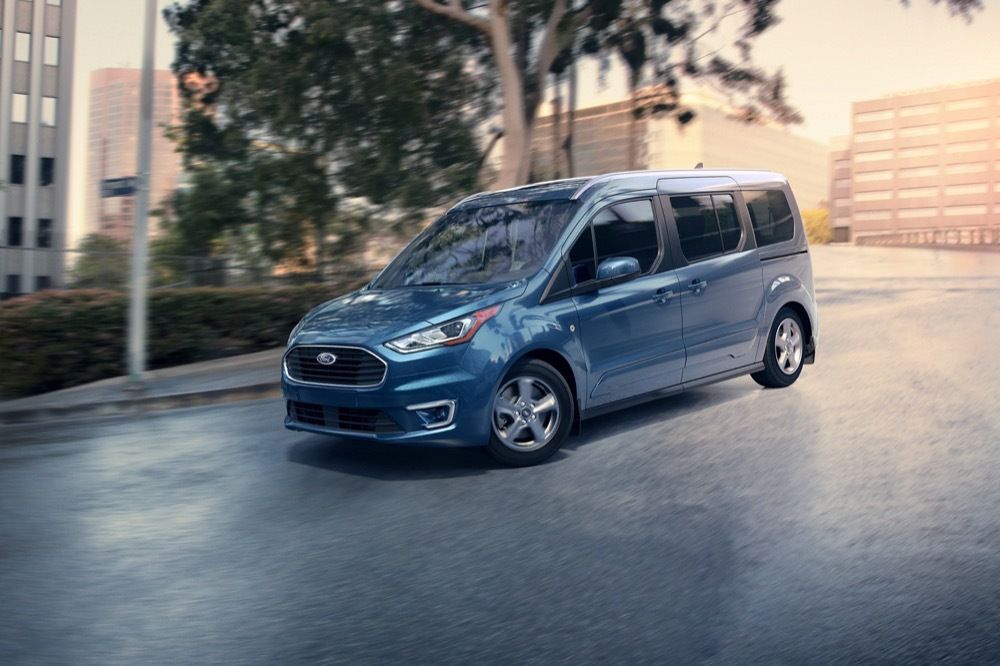
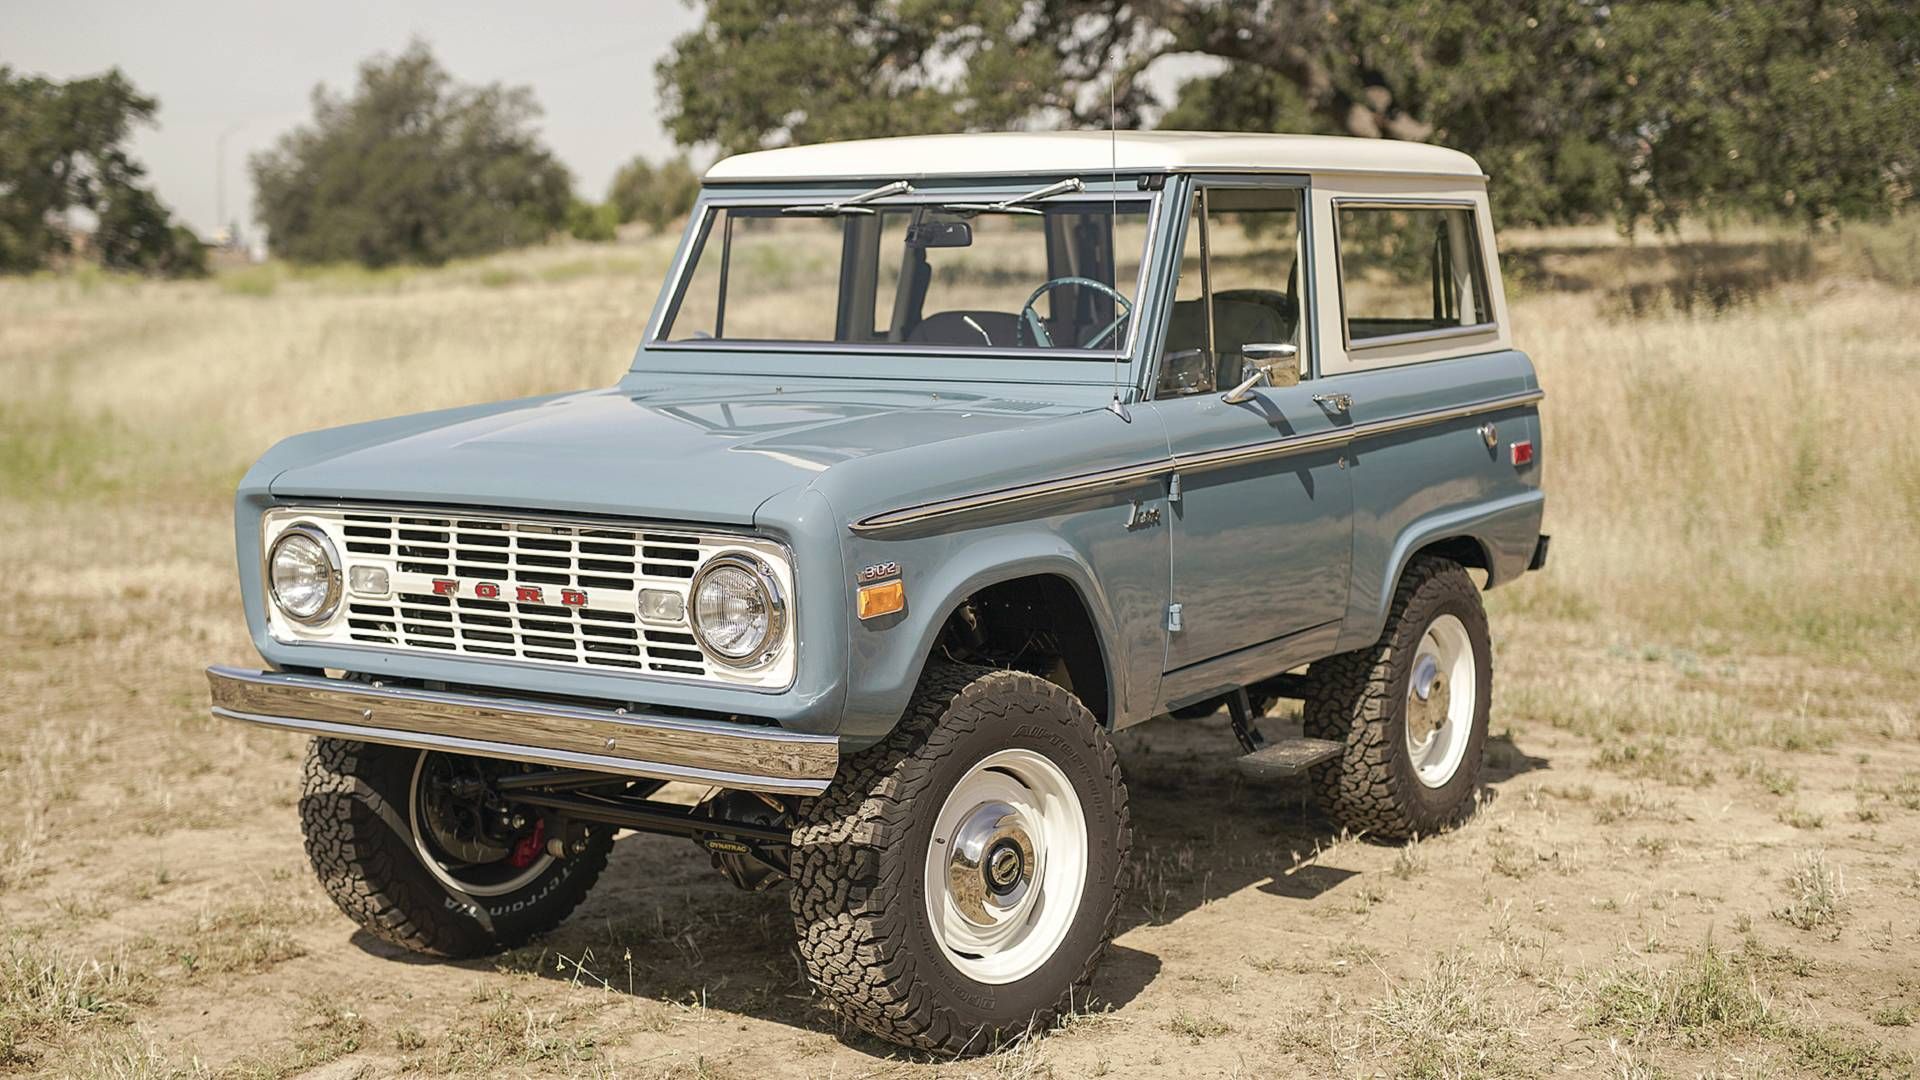
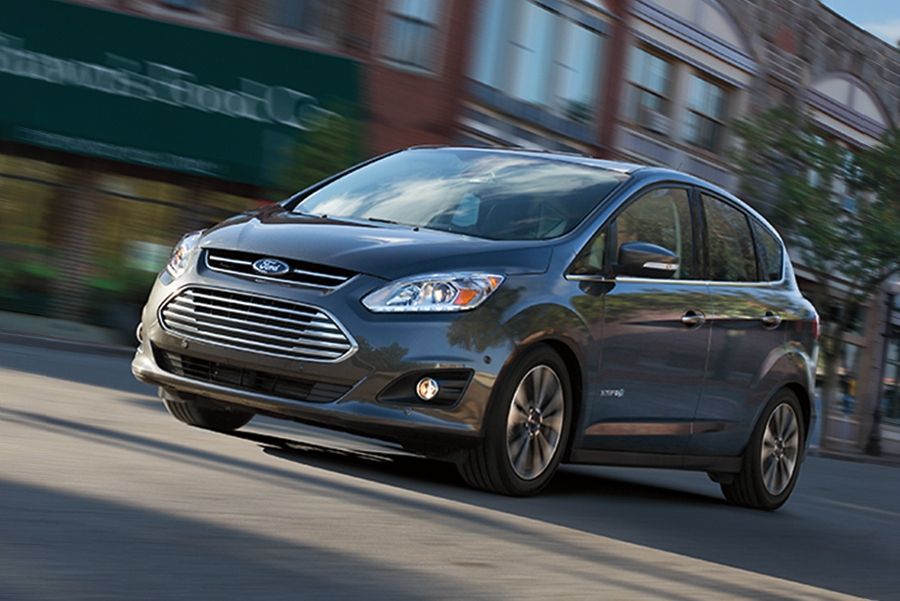
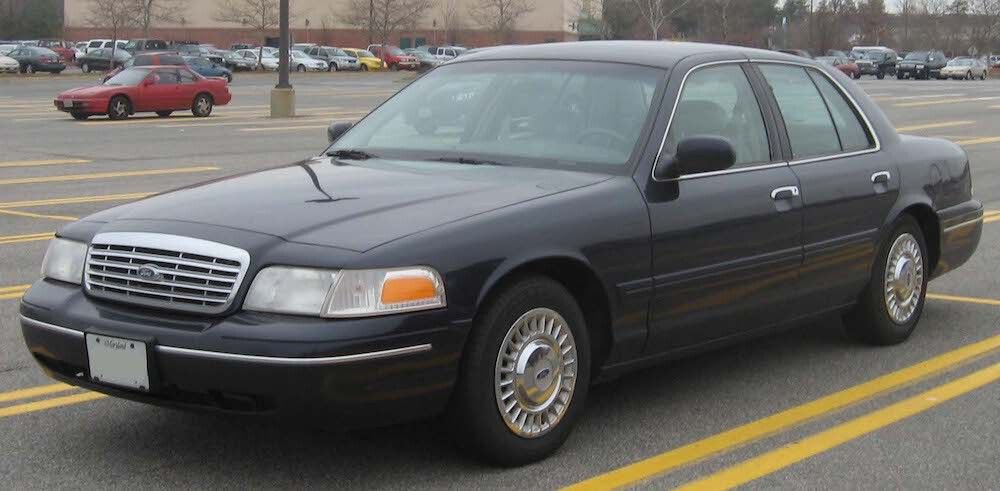
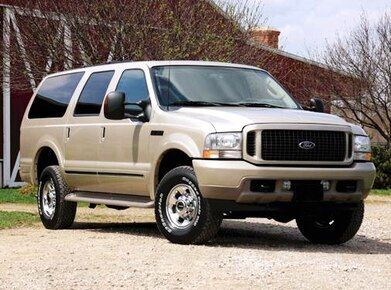
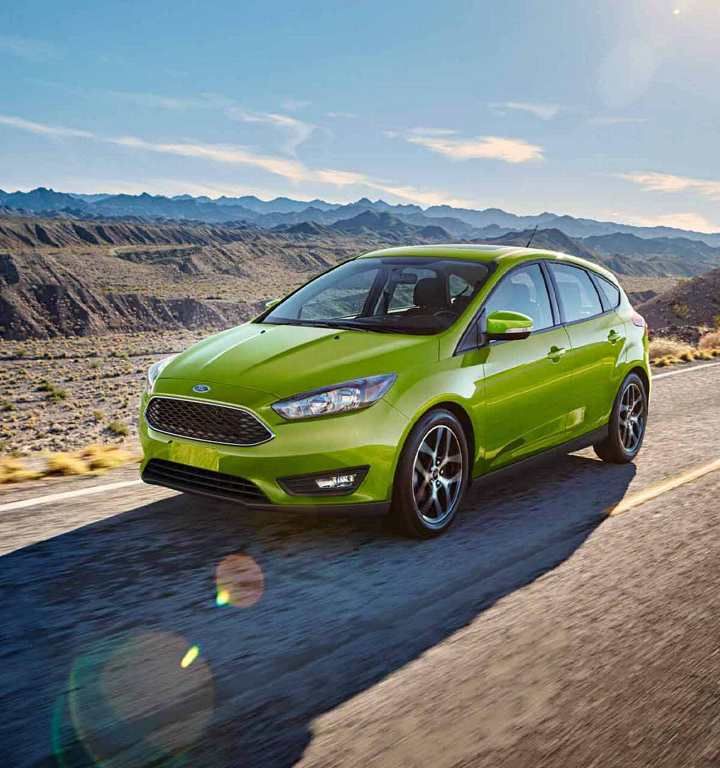
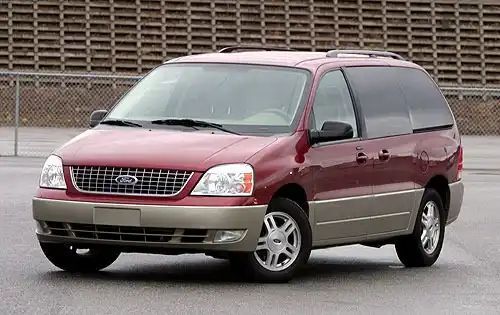
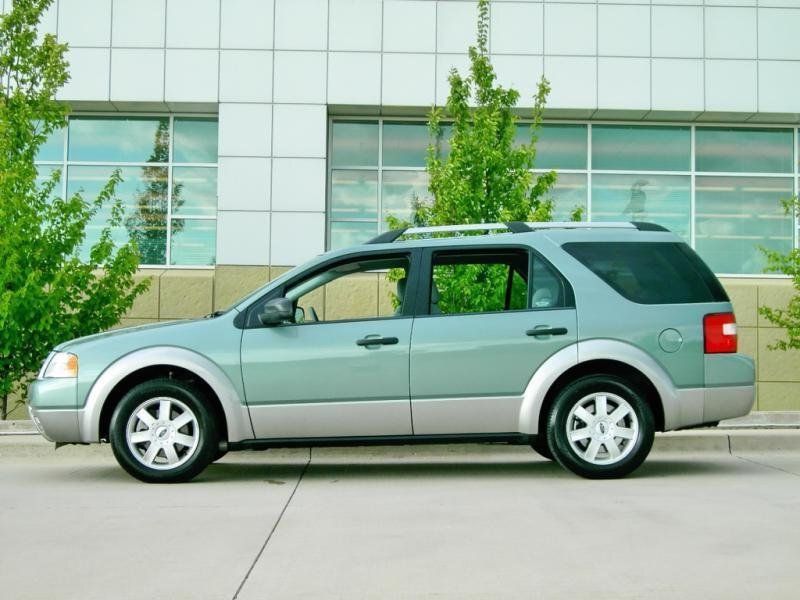
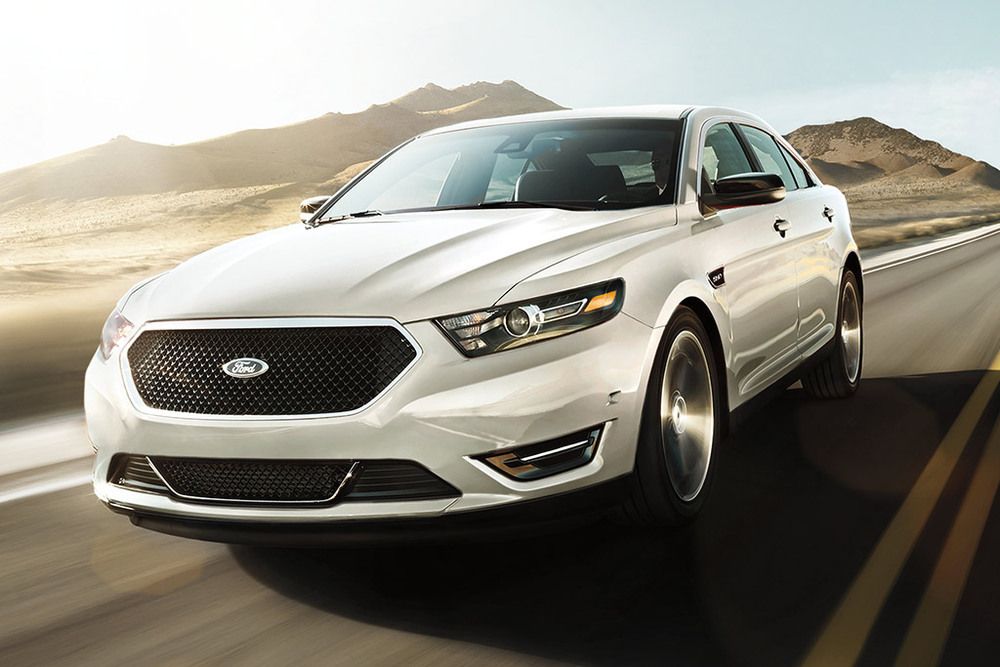
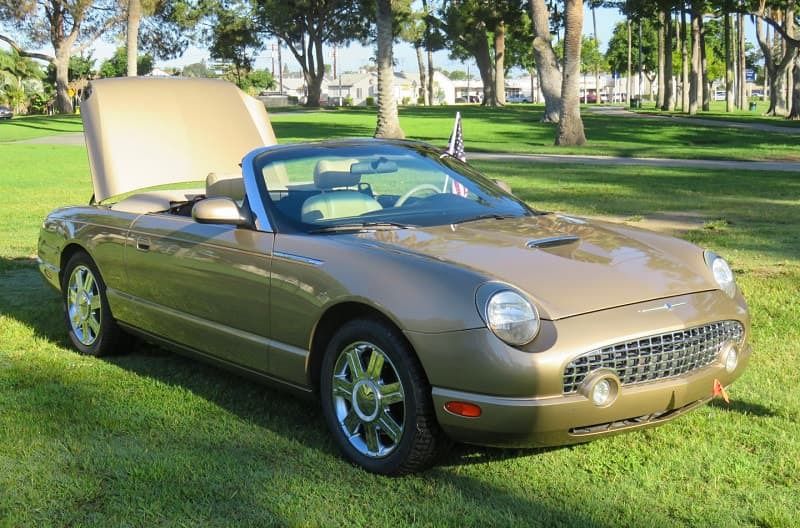
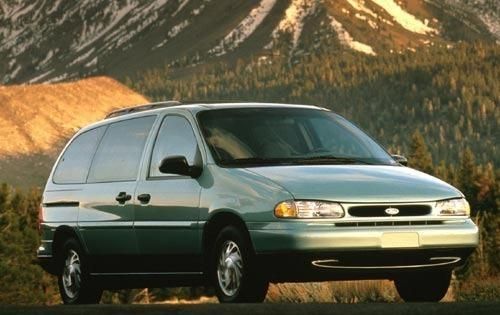
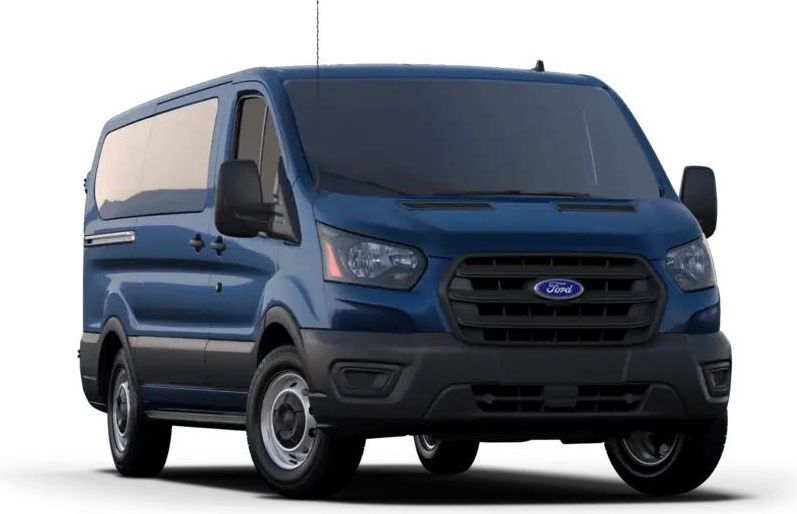
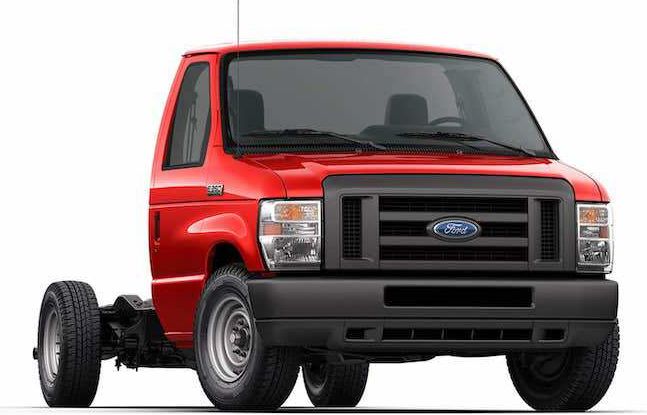
Ford includes the cars 2024 Bronco, Bronco, 2024 Bronco Sport, 2017 C-Max, 2011 Crown Victoria, 2024 EcoSport, 2024 Edge, 2024 Escape, 2019 E-Series, 2005 Excursion, 2024 Expedition, 2024 Explorer, 2024 Fiesta, 2024 Flex, 2024 Focus, 2007 Freestar, 2009 Freestyle / Taurus X, 2024 F-Series, 2024 Fusion, 2006 GT, 2024 Maverick, 2024 Mustang, 2022 Mustang Mach-E, 2014 Police Interceptor Sedan, 2020 Police Interceptor Utility, 2024 Ranger, 2024 Taurus, 2005 Thunderbird, 2024 Transit, 2024 Transit Connect, 2003 Windstar
Year | Q1 | Q2 | Q3 | Q4 |
|---|---|---|---|---|
| 2005 | 548,099 | 628,887 | 651,568 | 494,999 |
| 2006 | 549,466 | 607,971 | 548,625 | 462,792 |
| 2007 | 460,836 | 534,932 | 449,331 | 440,403 |
| 2008 | 446,413 | 460,695 | 354,435 | 313,662 |
| 2009 | 257,135 | 363,031 | 384,995 | 362,264 |
| 2010 | 360,564 | 450,520 | 428,978 | 427,963 |
| 2011 | 438,348 | 508,073 | 471,211 | 477,384 |
| 2012 | 636,409 | 532,813 | 522,767 | 539,671 |
| 2013 | 580,917 | 671,293 | 576,372 | 575,004 |
| 2014 | 560,576 | 663,244 | 589,875 | 566,914 |
| 2015 | 573,643 | 670,785 | 650,311 | 610,337 |
| 2016 | 616,602 | 675,191 | 604,985 | 590,629 |
| 2017 | 586,462 | 651,598 | 603,605 | 622,376 |
| 2018 | 574,332 | 650,319 | 581,928 | 578,262 |
| 2019 | 561,981 | 618,558 | 548,072 | 565,373 |
| 2020 | 489,053 | 411,036 | 521,580 | 507,629 |
| 2021 | 492,301 | 448,746 | 380,606 | 483,171 |
| 2022 | 383,614 | 453,579 | 441,487 | 459,175 |
| 2023 | 457,481 | 846,800 | 319,584 | 280,098 |
| 2024 | 309,461 | - | - | - |
Year | Sales |
|---|---|
| 2024 | 1,796,834 |
| 2023 | 1,903,963 |
| 2022 | 1,737,855 |
| 2021 | 1,804,824 |
| 2020 | 1,929,298 |
| 2019 | 2,293,984 |
| 2018 | 2,384,841 |
| 2017 | 2,464,041 |
| 2016 | 2,487,407 |
| 2015 | 2,505,076 |
| 2014 | 2,380,609 |
| 2013 | 2,403,586 |
| 2012 | 2,231,660 |
| 2011 | 1,895,016 |
| 2010 | 1,668,025 |
| 2009 | 1,367,425 |
| 2008 | 1,575,205 |
| 2007 | 1,885,502 |
| 2006 | 2,168,854 |
| 2005 | 2,323,553 |
| Total | 41,207,558 |

