

Key Stats
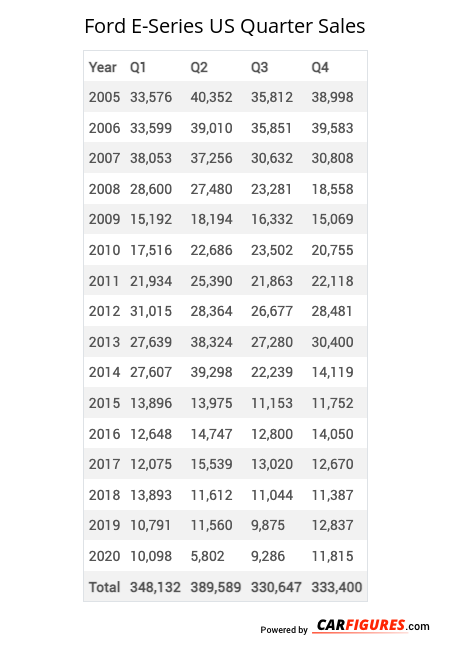
How many E-Series did Ford sell in Q4 2020?
Ford sold 11,815 E-Series in Q4 2020.
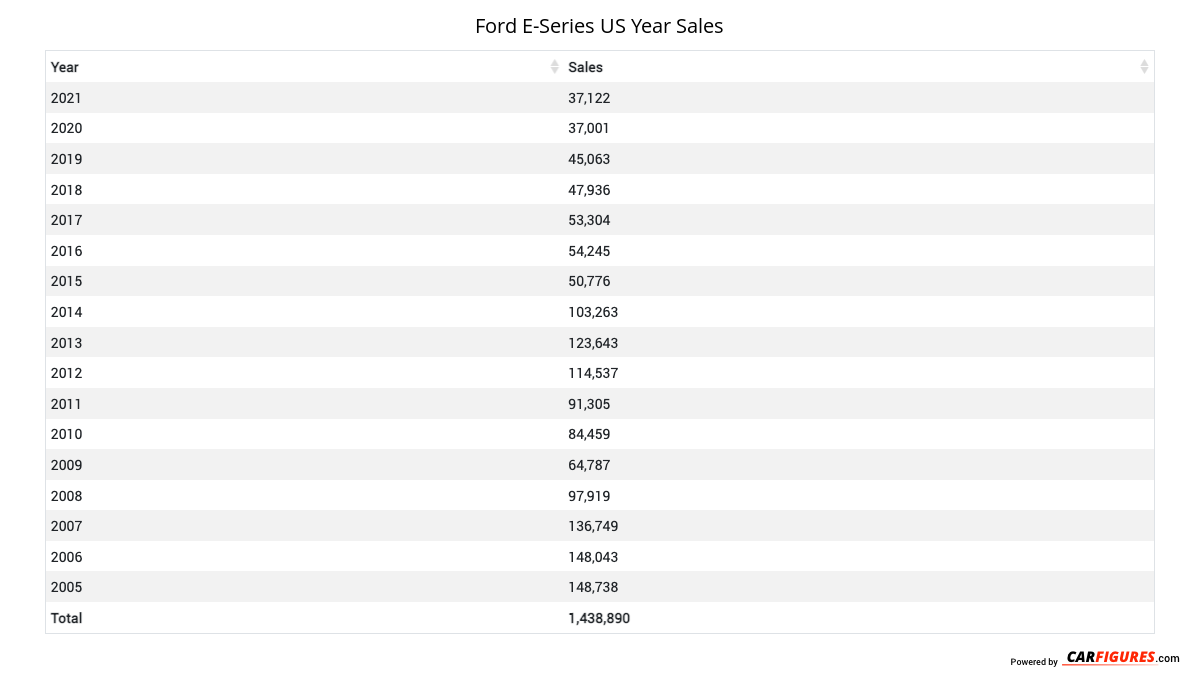
How many E-Series did Ford sell in 2024?
Ford sold 36,382 E-Series in 2024. In 2023, Ford sold 41,974 E-Series. They sold 5,592 more units in year 2023 compared to 2024 with a percent loss of 13.32% YoY.
Overview
The is a vehicle from automaker Ford.
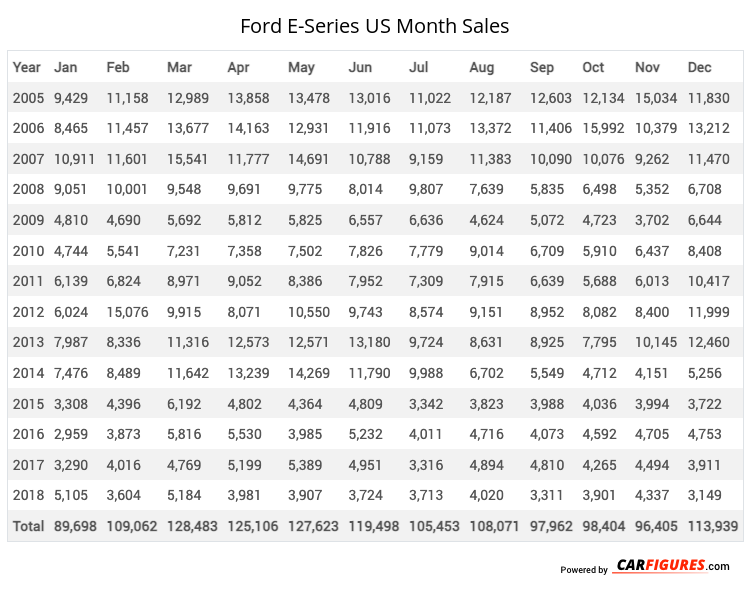
Ford E-Series United States Sale figures by year, quarter, and month are presented below. Including the most up to date sales data for the Ford E-Series.
For sales numbers of the Ford E-Series in Canada, click here.
Loading, please wait
Year | Jan | Feb | Mar | Apr | May | Jun | Jul | Aug | Sep | Oct | Nov | Dec |
|---|---|---|---|---|---|---|---|---|---|---|---|---|
| 2005 | 9,429 | 11,158 | 12,989 | 13,858 | 13,478 | 13,016 | 11,022 | 12,187 | 12,603 | 12,134 | 15,034 | 11,830 |
| 2006 | 8,465 | 11,457 | 13,677 | 14,163 | 12,931 | 11,916 | 11,073 | 13,372 | 11,406 | 15,992 | 10,379 | 13,212 |
| 2007 | 10,911 | 11,601 | 15,541 | 11,777 | 14,691 | 10,788 | 9,159 | 11,383 | 10,090 | 10,076 | 9,262 | 11,470 |
| 2008 | 9,051 | 10,001 | 9,548 | 9,691 | 9,775 | 8,014 | 9,807 | 7,639 | 5,835 | 6,498 | 5,352 | 6,708 |
| 2009 | 4,810 | 4,690 | 5,692 | 5,812 | 5,825 | 6,557 | 6,636 | 4,624 | 5,072 | 4,723 | 3,702 | 6,644 |
| 2010 | 4,744 | 5,541 | 7,231 | 7,358 | 7,502 | 7,826 | 7,779 | 9,014 | 6,709 | 5,910 | 6,437 | 8,408 |
| 2011 | 6,139 | 6,824 | 8,971 | 9,052 | 8,386 | 7,952 | 7,309 | 7,915 | 6,639 | 5,688 | 6,013 | 10,417 |
| 2012 | 6,024 | 15,076 | 9,915 | 8,071 | 10,550 | 9,743 | 8,574 | 9,151 | 8,952 | 8,082 | 8,400 | 11,999 |
| 2013 | 7,987 | 8,336 | 11,316 | 12,573 | 12,571 | 13,180 | 9,724 | 8,631 | 8,925 | 7,795 | 10,145 | 12,460 |
| 2014 | 7,476 | 8,489 | 11,642 | 13,239 | 14,269 | 11,790 | 9,988 | 6,702 | 5,549 | 4,712 | 4,151 | 5,256 |
| 2015 | 3,308 | 4,396 | 6,192 | 4,802 | 4,364 | 4,809 | 3,342 | 3,823 | 3,988 | 4,036 | 3,994 | 3,722 |
| 2016 | 2,959 | 3,873 | 5,816 | 5,530 | 3,985 | 5,232 | 4,011 | 4,716 | 4,073 | 4,592 | 4,705 | 4,753 |
| 2017 | 3,290 | 4,016 | 4,769 | 5,199 | 5,389 | 4,951 | 3,316 | 4,894 | 4,810 | 4,265 | 4,494 | 3,911 |
| 2018 | 5,105 | 3,604 | 5,184 | 3,981 | 3,907 | 3,724 | 3,713 | 4,020 | 3,311 | 3,901 | 4,337 | 3,149 |
| Total | 89,698 | 109,062 | 128,483 | 125,106 | 127,623 | 119,498 | 105,453 | 108,071 | 97,962 | 98,404 | 96,405 | 113,939 |
Loading, please wait
Year | Q1 | Q2 | Q3 | Q4 |
|---|---|---|---|---|
| 2005 | 33,576 | 40,352 | 35,812 | 38,998 |
| 2006 | 33,599 | 39,010 | 35,851 | 39,583 |
| 2007 | 38,053 | 37,256 | 30,632 | 30,808 |
| 2008 | 28,600 | 27,480 | 23,281 | 18,558 |
| 2009 | 15,192 | 18,194 | 16,332 | 15,069 |
| 2010 | 17,516 | 22,686 | 23,502 | 20,755 |
| 2011 | 21,934 | 25,390 | 21,863 | 22,118 |
| 2012 | 31,015 | 28,364 | 26,677 | 28,481 |
| 2013 | 27,639 | 38,324 | 27,280 | 30,400 |
| 2014 | 27,607 | 39,298 | 22,239 | 14,119 |
| 2015 | 13,896 | 13,975 | 11,153 | 11,752 |
| 2016 | 12,648 | 14,747 | 12,800 | 14,050 |
| 2017 | 12,075 | 15,539 | 13,020 | 12,670 |
| 2018 | 13,893 | 11,612 | 11,044 | 11,387 |
| 2019 | 10,791 | 11,560 | 9,875 | 12,837 |
| 2020 | 10,098 | 5,802 | 9,286 | 11,815 |
| Total | 348,132 | 389,589 | 330,647 | 333,400 |
Loading, please wait
Year | Sales |
|---|---|
| 2024 | 36,382 |
| 2023 | 41,974 |
| 2022 | 32,150 |
| 2021 | 37,122 |
| 2020 | 37,001 |
| 2019 | 45,063 |
| 2018 | 47,936 |
| 2017 | 53,304 |
| 2016 | 54,245 |
| 2015 | 50,776 |
| 2014 | 103,263 |
| 2013 | 123,643 |
| 2012 | 114,537 |
| 2011 | 91,305 |
| 2010 | 84,459 |
| 2009 | 64,787 |
| 2008 | 97,919 |
| 2007 | 136,749 |
| 2006 | 148,043 |
| 2005 | 148,738 |
| Total | 1,549,396 |
Download Historic Sales Data
Embedded Code
See more widgetsSources: Manufacturers