Key Stats
How many F-Series did Ford sell in Q4 2024?
Ford sold 214,814 F-Series in Q4 2024.
How many F-Series did Ford sell in 2024?
Ford sold 716,801 F-Series in 2024. In 2023, Ford sold 761,455 F-Series. They sold 44,654 more units in year 2023 compared to 2024 with a percent loss of 5.86% YoY.
Overview
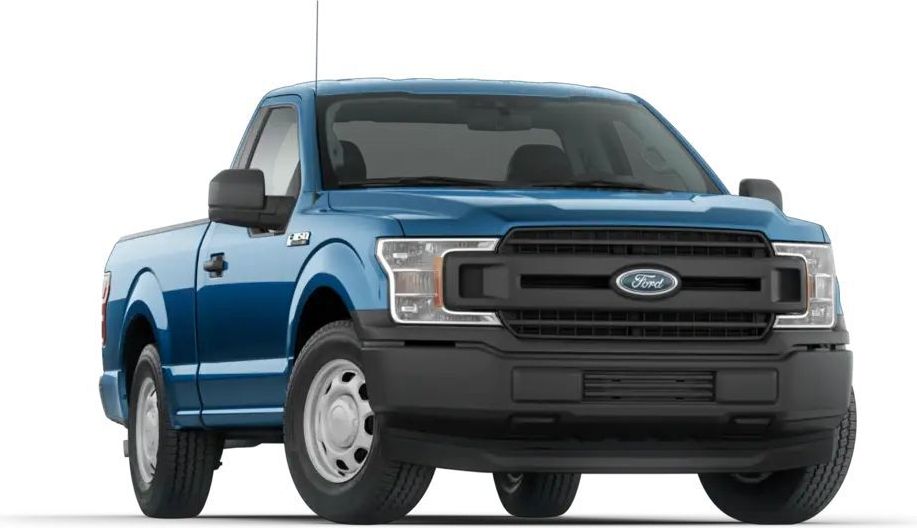
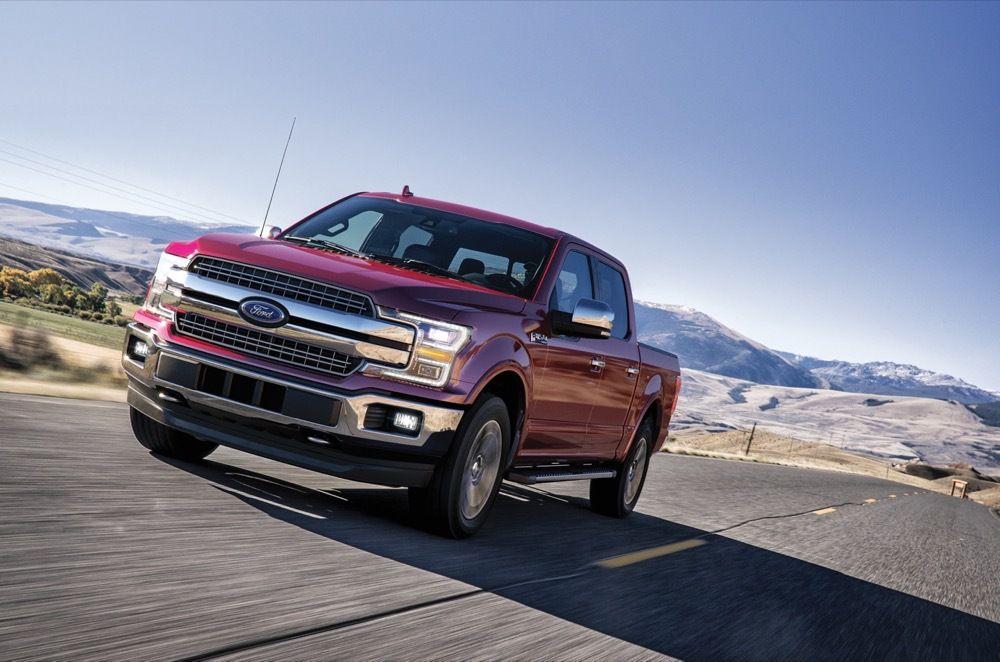
The 2022 Ford F-150 is a vehicle from automaker Ford.
How Much Does the 2022 Ford F-150 Cost?
Pricing for the 2022 Ford F-150 starts at $29,990 MSRP and goes up to $77,760 fully loaded.
Ford F-150 Engine, Transmission, and Performance Numbers
Ford F-150 includes a 3.3-liter engine combined with a Electronic 10-Speed Automatic. This delivers 290 hp with 265 lb-ft torque delivered through a Rear Wheel Drive drivetrain.
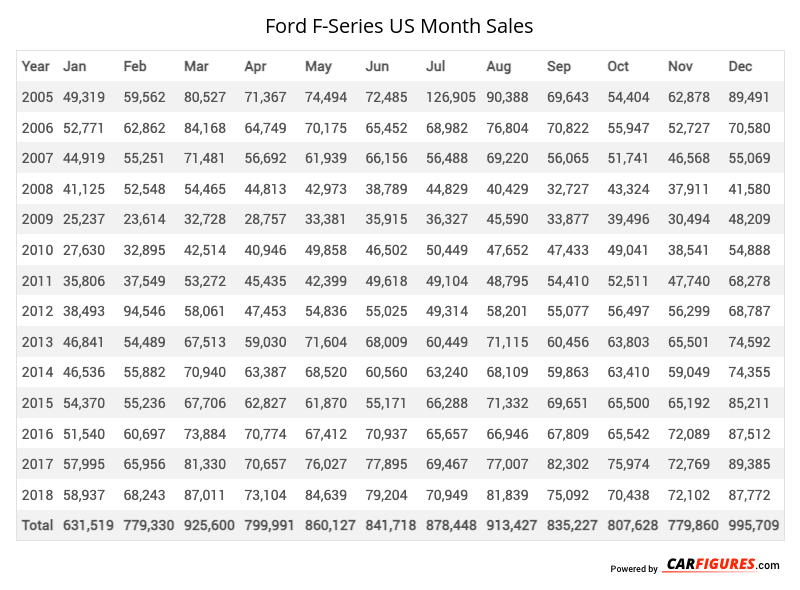
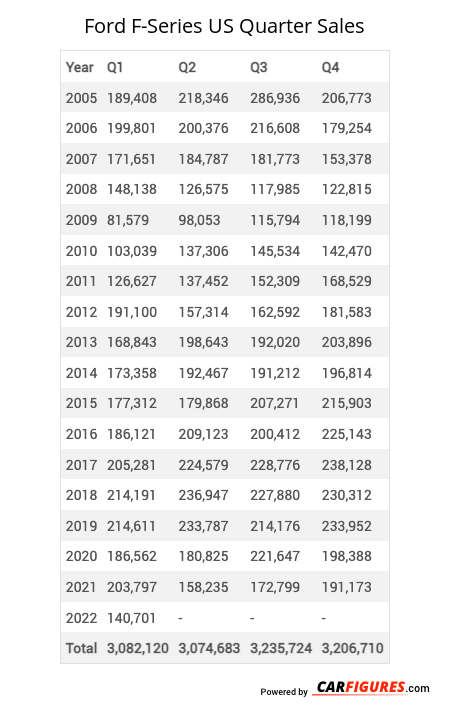
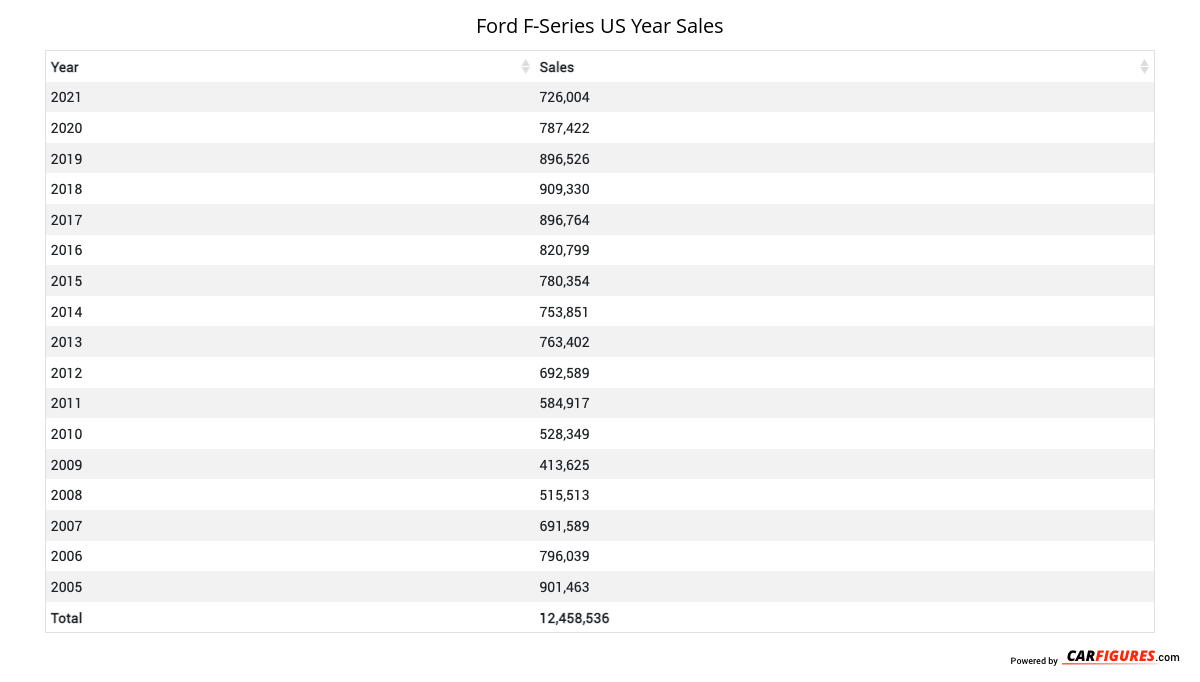
Ford F-Series United States Sale figures by year, quarter, and month are presented below. Including the most up to date sales data for the Ford F-Series. See how the Ford F-Series stacks up the other models in the Large Pickup Trucks, Pickup Trucks segments.
Year | Jan | Feb | Mar | Apr | May | Jun | Jul | Aug | Sep | Oct | Nov | Dec |
|---|---|---|---|---|---|---|---|---|---|---|---|---|
| 2005 | 49,319 | 59,562 | 80,527 | 71,367 | 74,494 | 72,485 | 126,905 | 90,388 | 69,643 | 54,404 | 62,878 | 89,491 |
| 2006 | 52,771 | 62,862 | 84,168 | 64,749 | 70,175 | 65,452 | 68,982 | 76,804 | 70,822 | 55,947 | 52,727 | 70,580 |
| 2007 | 44,919 | 55,251 | 71,481 | 56,692 | 61,939 | 66,156 | 56,488 | 69,220 | 56,065 | 51,741 | 46,568 | 55,069 |
| 2008 | 41,125 | 52,548 | 54,465 | 44,813 | 42,973 | 38,789 | 44,829 | 40,429 | 32,727 | 43,324 | 37,911 | 41,580 |
| 2009 | 25,237 | 23,614 | 32,728 | 28,757 | 33,381 | 35,915 | 36,327 | 45,590 | 33,877 | 39,496 | 30,494 | 48,209 |
| 2010 | 27,630 | 32,895 | 42,514 | 40,946 | 49,858 | 46,502 | 50,449 | 47,652 | 47,433 | 49,041 | 38,541 | 54,888 |
| 2011 | 35,806 | 37,549 | 53,272 | 45,435 | 42,399 | 49,618 | 49,104 | 48,795 | 54,410 | 52,511 | 47,740 | 68,278 |
| 2012 | 38,493 | 94,546 | 58,061 | 47,453 | 54,836 | 55,025 | 49,314 | 58,201 | 55,077 | 56,497 | 56,299 | 68,787 |
| 2013 | 46,841 | 54,489 | 67,513 | 59,030 | 71,604 | 68,009 | 60,449 | 71,115 | 60,456 | 63,803 | 65,501 | 74,592 |
| 2014 | 46,536 | 55,882 | 70,940 | 63,387 | 68,520 | 60,560 | 63,240 | 68,109 | 59,863 | 63,410 | 59,049 | 74,355 |
| 2015 | 54,370 | 55,236 | 67,706 | 62,827 | 61,870 | 55,171 | 66,288 | 71,332 | 69,651 | 65,500 | 65,192 | 85,211 |
| 2016 | 51,540 | 60,697 | 73,884 | 70,774 | 67,412 | 70,937 | 65,657 | 66,946 | 67,809 | 65,542 | 72,089 | 87,512 |
| 2017 | 57,995 | 65,956 | 81,330 | 70,657 | 76,027 | 77,895 | 69,467 | 77,007 | 82,302 | 75,974 | 72,769 | 89,385 |
| 2018 | 58,937 | 68,243 | 87,011 | 73,104 | 84,639 | 79,204 | 70,949 | 81,839 | 75,092 | 70,438 | 72,102 | 87,772 |
| Total | 631,519 | 779,330 | 925,600 | 799,991 | 860,127 | 841,718 | 878,448 | 913,427 | 835,227 | 807,628 | 779,860 | 995,709 |
Year | Q1 | Q2 | Q3 | Q4 |
|---|---|---|---|---|
| 2005 | 189,408 | 218,346 | 286,936 | 206,773 |
| 2006 | 199,801 | 200,376 | 216,608 | 179,254 |
| 2007 | 171,651 | 184,787 | 181,773 | 153,378 |
| 2008 | 148,138 | 126,575 | 117,985 | 122,815 |
| 2009 | 81,579 | 98,053 | 115,794 | 118,199 |
| 2010 | 103,039 | 137,306 | 145,534 | 142,470 |
| 2011 | 126,627 | 137,452 | 152,309 | 168,529 |
| 2012 | 191,100 | 157,314 | 162,592 | 181,583 |
| 2013 | 168,843 | 198,643 | 192,020 | 203,896 |
| 2014 | 173,358 | 192,467 | 191,212 | 196,814 |
| 2015 | 177,312 | 179,868 | 207,271 | 215,903 |
| 2016 | 186,121 | 209,123 | 200,412 | 225,143 |
| 2017 | 205,281 | 224,579 | 228,776 | 238,128 |
| 2018 | 214,191 | 236,947 | 227,880 | 230,312 |
| 2019 | 214,611 | 233,787 | 214,176 | 233,952 |
| 2020 | 186,562 | 180,825 | 221,647 | 198,388 |
| 2021 | 203,797 | 158,235 | 172,799 | 191,173 |
| 2022 | 140,701 | 158,644 | 167,962 | 186,650 |
| 2023 | 170,377 | 352,677 | 131,823 | 106,578 |
| 2024 | 100,531 | 134,035 | 267,421 | 214,814 |
| Total | 3,353,028 | 3,720,039 | 3,802,930 | 3,714,752 |
Year | Sales |
|---|---|
| 2024 | 716,801 |
| 2023 | 761,455 |
| 2022 | 653,957 |
| 2021 | 726,004 |
| 2020 | 787,422 |
| 2019 | 896,526 |
| 2018 | 909,330 |
| 2017 | 896,764 |
| 2016 | 820,799 |
| 2015 | 780,354 |
| 2014 | 753,851 |
| 2013 | 763,402 |
| 2012 | 692,589 |
| 2011 | 584,917 |
| 2010 | 528,349 |
| 2009 | 413,625 |
| 2008 | 515,513 |
| 2007 | 691,589 |
| 2006 | 796,039 |
| 2005 | 901,463 |
| Total | 14,590,749 |
Download Historic Sales Data
Looking for more data/visualizations? Send us an email at contact@carfigures.com for customized data aggregates and visualizations.Embedded Code
See more widgetsSources: Manufacturers

