Key Stats
How many Transit Connect did Ford sell in 2024?
Ford sold 6,959 Transit Connect in 2024. In 2023, Ford sold 17,424 Transit Connect. They sold 10,465 more units in year 2023 compared to 2024 with a percent loss of 60.06% YoY.
Overview
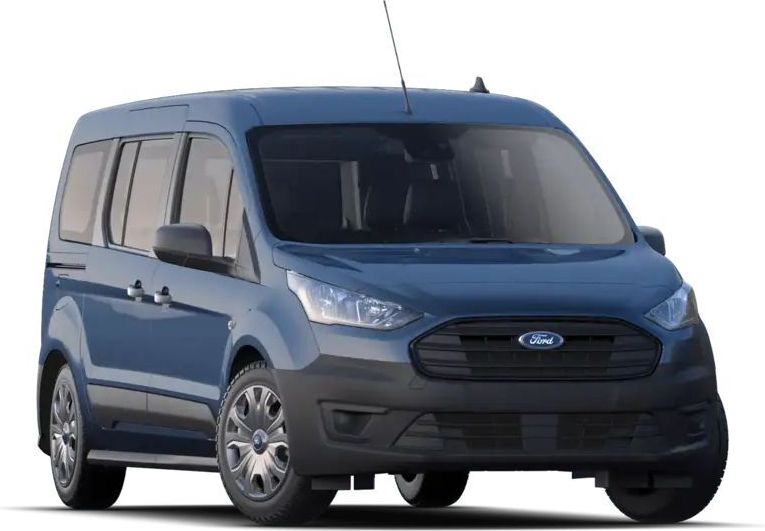
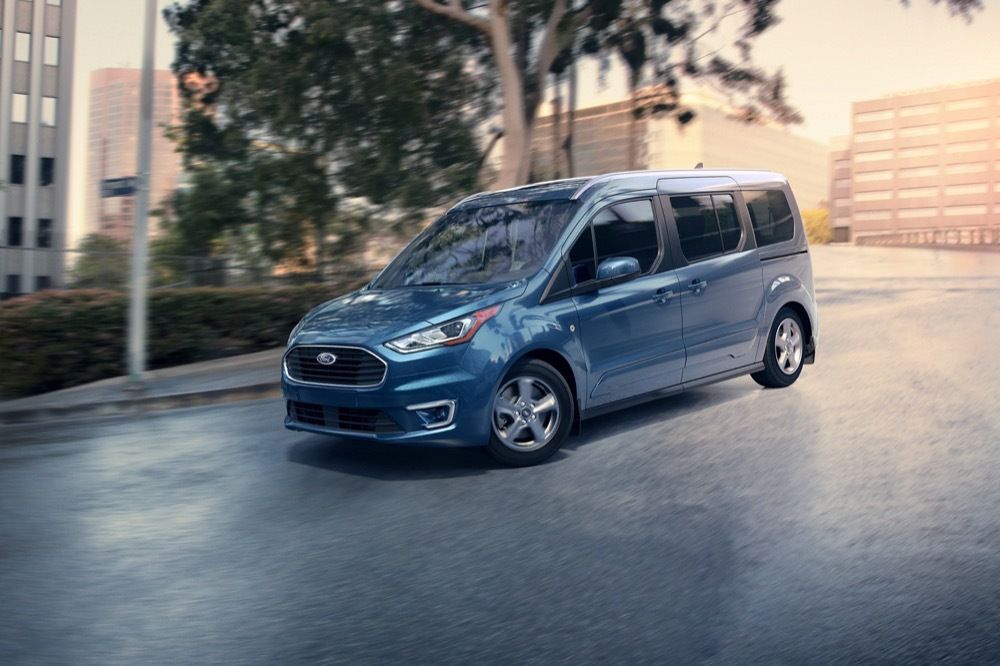
The 2022 Ford Transit Connect is a vehicle from automaker Ford.
How Much Does the 2022 Ford Transit Connect Cost?
The 2022 Ford Transit Connect starts at $25,175 MSRP. Fully loaded, the Ford Transit Connect will cost you about $32,120.
Ford Transit Connect Engine, Transmission, and Performance Numbers
The Ford Transit Connect includes a 2.0-liter coupled with an 8-Speed SelectShift Automatic (STD) that delivers 162 hp and 144 lb-ft torque with a Front Wheel Drive drivetrain.
List of Ford Transit Connect Competitors
Some of Ford Transit Connect competitors include the Nissan NV200, Ram ProMaster City and Mercedes-Benz Metris.
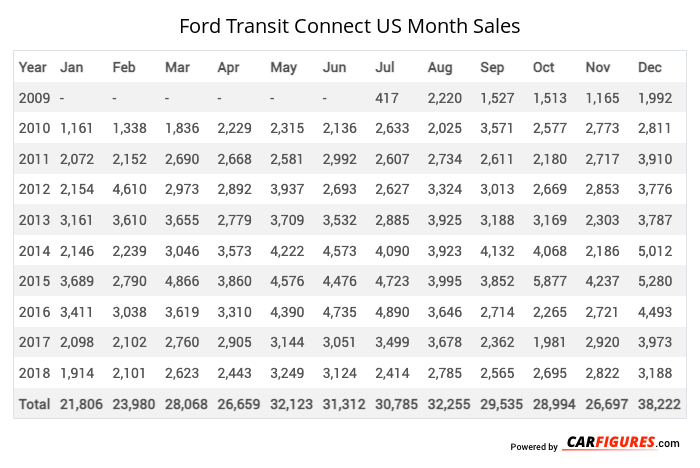
Ford Transit Connect United States Sale figures by year, quarter, and month are presented below. Including the most up to date sales data for the Ford Transit Connect. See how the Ford Transit Connect stacks up the other models in the Cargo/Passenger Vans, Vans segments.
Year | Jan | Feb | Mar | Apr | May | Jun | Jul | Aug | Sep | Oct | Nov | Dec |
|---|---|---|---|---|---|---|---|---|---|---|---|---|
| 2009 | - | - | - | - | - | - | 417 | 2,220 | 1,527 | 1,513 | 1,165 | 1,992 |
| 2010 | 1,161 | 1,338 | 1,836 | 2,229 | 2,315 | 2,136 | 2,633 | 2,025 | 3,571 | 2,577 | 2,773 | 2,811 |
| 2011 | 2,072 | 2,152 | 2,690 | 2,668 | 2,581 | 2,992 | 2,607 | 2,734 | 2,611 | 2,180 | 2,717 | 3,910 |
| 2012 | 2,154 | 4,610 | 2,973 | 2,892 | 3,937 | 2,693 | 2,627 | 3,324 | 3,013 | 2,669 | 2,853 | 3,776 |
| 2013 | 3,161 | 3,610 | 3,655 | 2,779 | 3,709 | 3,532 | 2,885 | 3,925 | 3,188 | 3,169 | 2,303 | 3,787 |
| 2014 | 2,146 | 2,239 | 3,046 | 3,573 | 4,222 | 4,573 | 4,090 | 3,923 | 4,132 | 4,068 | 2,186 | 5,012 |
| 2015 | 3,689 | 2,790 | 4,866 | 3,860 | 4,576 | 4,476 | 4,723 | 3,995 | 3,852 | 5,877 | 4,237 | 5,280 |
| 2016 | 3,411 | 3,038 | 3,619 | 3,310 | 4,390 | 4,735 | 4,890 | 3,646 | 2,714 | 2,265 | 2,721 | 4,493 |
| 2017 | 2,098 | 2,102 | 2,760 | 2,905 | 3,144 | 3,051 | 3,499 | 3,678 | 2,362 | 1,981 | 2,920 | 3,973 |
| 2018 | 1,914 | 2,101 | 2,623 | 2,443 | 3,249 | 3,124 | 2,414 | 2,785 | 2,565 | 2,695 | 2,822 | 3,188 |
| Total | 21,806 | 23,980 | 28,068 | 26,659 | 32,123 | 31,312 | 30,785 | 32,255 | 29,535 | 28,994 | 26,697 | 38,222 |
Year | Q1 | Q2 | Q3 | Q4 |
|---|---|---|---|---|
| 2009 | - | - | 4,164 | 4,670 |
| 2010 | 4,335 | 6,680 | 8,229 | 8,161 |
| 2011 | 6,914 | 8,241 | 7,952 | 8,807 |
| 2012 | 9,737 | 9,522 | 8,964 | 9,298 |
| 2013 | 10,426 | 10,020 | 9,998 | 9,259 |
| 2014 | 7,431 | 12,368 | 12,145 | 11,266 |
| 2015 | 11,345 | 12,912 | 12,570 | 15,394 |
| 2016 | 10,068 | 12,435 | 11,250 | 9,479 |
| 2017 | 6,960 | 9,100 | 9,539 | 8,874 |
| 2018 | 6,638 | 8,816 | 7,764 | 8,705 |
| 2019 | 8,940 | 10,913 | 11,537 | 10,208 |
| 2020 | 7,565 | 6,760 | 10,916 | 9,355 |
| 2021 | 7,623 | 9,317 | 2,681 | 6,491 |
| 2022 | 7,357 | 6,750 | 6,076 | 4,957 |
| 2023 | 3,823 | 8,340 | 2,790 | 2,471 |
| 2024 | 3,274 | 1,960 | 1,725 | 0 |
| 2025 | - | - | - | - |
| Total | 112,436 | 134,134 | 128,300 | 127,395 |
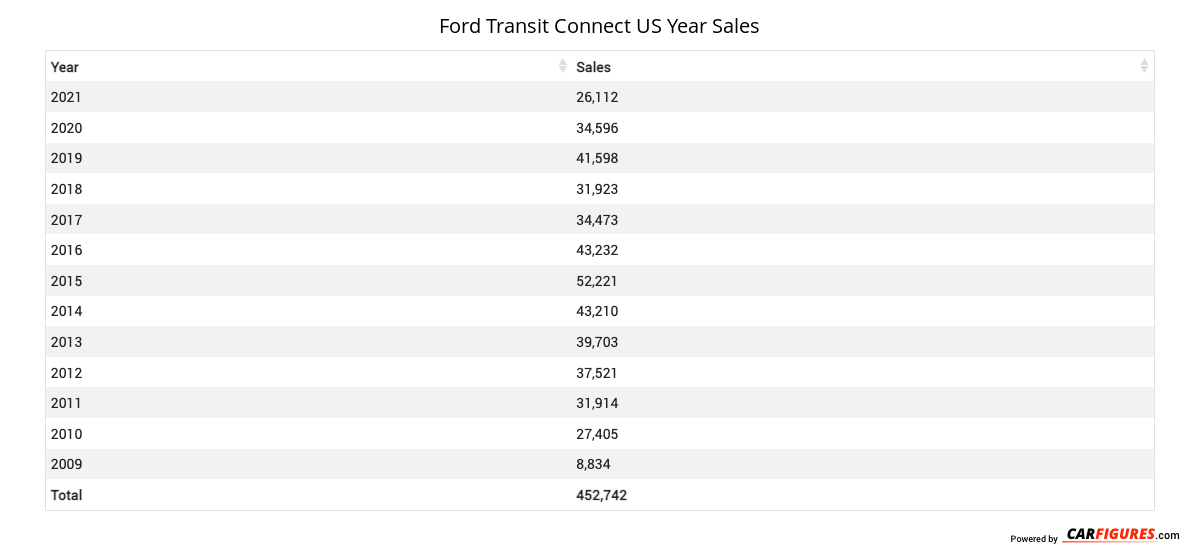
Year | Sales |
|---|---|
| 2024 | 6,959 |
| 2023 | 17,424 |
| 2022 | 25,140 |
| 2021 | 26,112 |
| 2020 | 34,596 |
| 2019 | 41,598 |
| 2018 | 31,923 |
| 2017 | 34,473 |
| 2016 | 43,232 |
| 2015 | 52,221 |
| 2014 | 43,210 |
| 2013 | 39,703 |
| 2012 | 37,521 |
| 2011 | 31,914 |
| 2010 | 27,405 |
| 2009 | 8,834 |
| Total | 502,265 |
Download Historic Sales Data

Embedded Code
See more widgetsSources: Manufacturers