

Key Stats
How many Transit did Ford sell in 2024?
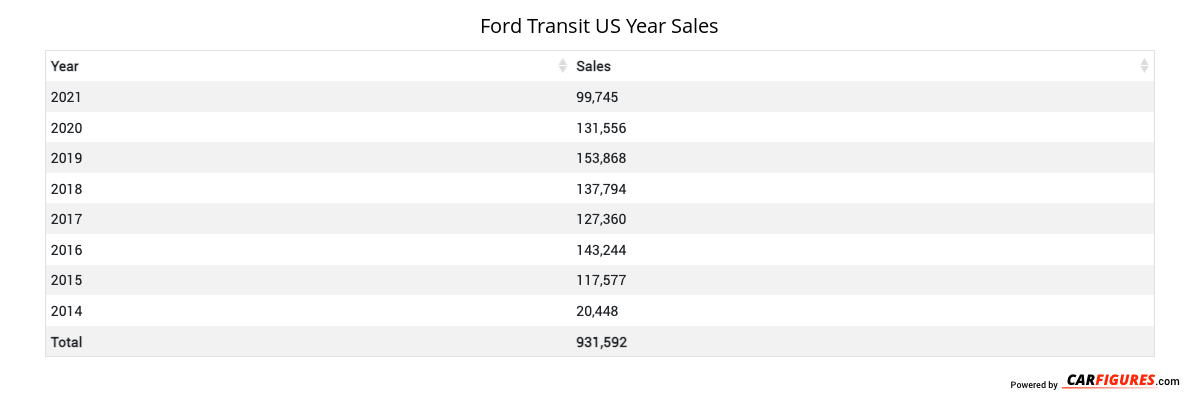
Ford sold 138,084 Transit in 2024. In 2023, Ford sold 126,618 Transit. They sold 11,466 more units in 2024 compared to 2023 with a percent gain of 9.06% YoY.
Overview
The is a vehicle from automaker Ford.
Engine, Transmission, and Performance Numbers
Is powered by a 3.5-liter V-6 engine with a RWD powertrain that makes 275 -hp and torque. The transmission on the is an.
List of Competitors
Some of competitors include the Mercedes-Benz Sprinter and Ford Transit Connect.
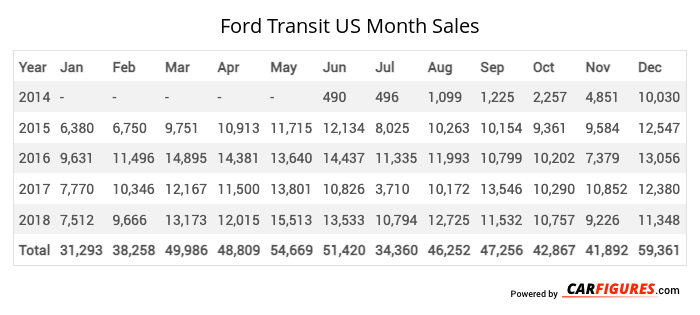
Ford Transit United States Sale figures by year, quarter, and month are presented below. Including the most up to date sales data for the Ford Transit. See how the Ford Transit stacks up the other models in the Cargo/Passenger Vans, Vans segments.
Year | Jan | Feb | Mar | Apr | May | Jun | Jul | Aug | Sep | Oct | Nov | Dec |
|---|---|---|---|---|---|---|---|---|---|---|---|---|
| 2014 | - | - | - | - | - | 490 | 496 | 1,099 | 1,225 | 2,257 | 4,851 | 10,030 |
| 2015 | 6,380 | 6,750 | 9,751 | 10,913 | 11,715 | 12,134 | 8,025 | 10,263 | 10,154 | 9,361 | 9,584 | 12,547 |
| 2016 | 9,631 | 11,496 | 14,895 | 14,381 | 13,640 | 14,437 | 11,335 | 11,993 | 10,799 | 10,202 | 7,379 | 13,056 |
| 2017 | 7,770 | 10,346 | 12,167 | 11,500 | 13,801 | 10,826 | 3,710 | 10,172 | 13,546 | 10,290 | 10,852 | 12,380 |
| 2018 | 7,512 | 9,666 | 13,173 | 12,015 | 15,513 | 13,533 | 10,794 | 12,725 | 11,532 | 10,757 | 9,226 | 11,348 |
| Total | 31,293 | 38,258 | 49,986 | 48,809 | 54,669 | 51,420 | 34,360 | 46,252 | 47,256 | 42,867 | 41,892 | 59,361 |
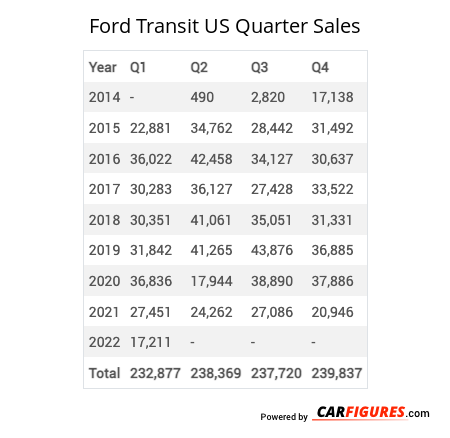
Year | Q1 | Q2 | Q3 | Q4 |
|---|---|---|---|---|
| 2014 | - | 490 | 2,820 | 17,138 |
| 2015 | 22,881 | 34,762 | 28,442 | 31,492 |
| 2016 | 36,022 | 42,458 | 34,127 | 30,637 |
| 2017 | 30,283 | 36,127 | 27,428 | 33,522 |
| 2018 | 30,351 | 41,061 | 35,051 | 31,331 |
| 2019 | 31,842 | 41,265 | 43,876 | 36,885 |
| 2020 | 36,836 | 17,944 | 38,890 | 37,886 |
| 2021 | 27,451 | 24,262 | 27,086 | 20,946 |
| 2022 | 17,211 | 24,617 | 26,505 | 31,049 |
| 2023 | 32,015 | 52,719 | 25,157 | 16,727 |
| 2024 | 27,601 | 28,274 | 43,752 | 38,457 |
| 2025 | - | - | - | - |
| Total | 292,493 | 343,979 | 333,134 | 326,070 |
Year | Sales |
|---|---|
| 2024 | 138,084 |
| 2023 | 126,618 |
| 2022 | 99,382 |
| 2021 | 99,745 |
| 2020 | 131,556 |
| 2019 | 153,868 |
| 2018 | 137,794 |
| 2017 | 127,360 |
| 2016 | 143,244 |
| 2015 | 117,577 |
| 2014 | 20,448 |
| Total | 1,295,676 |
Download Historic Sales Data
Embedded Code
See more widgetsSources: Manufacturers