Last updated: January 03, 2025

Overview
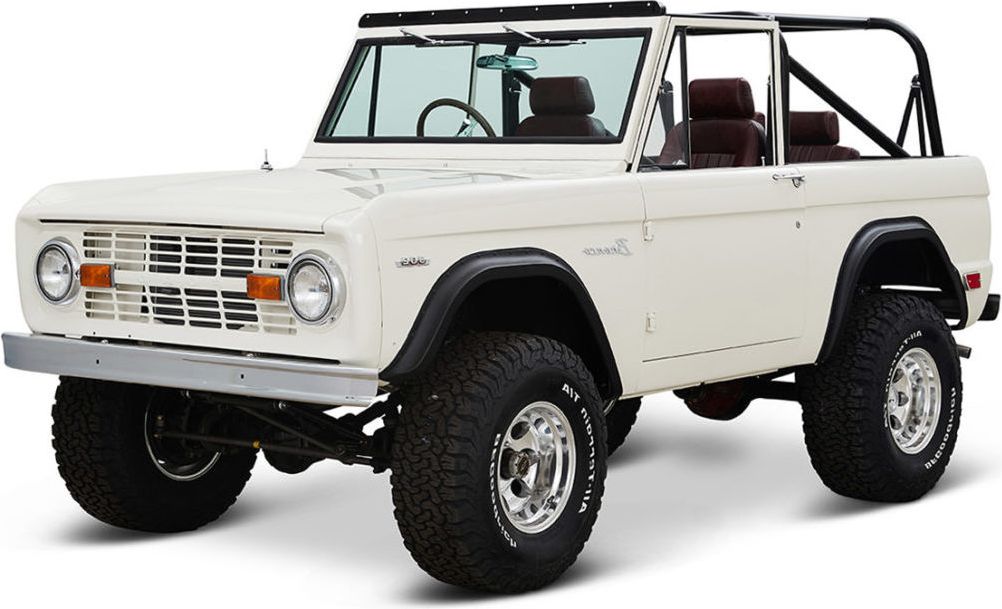
The Ford GT is a Coupe with room for 2 people.
Ford GT Engine, Transmission, and Performance Numbers
Ford GT is powered by a 5.4-liter V-8 engine with a RWD powertrain that makes 550 -hp and 500 lbs.-ft. Torque. The transmission on the Ford GT is an 6-speed manual.
2006 Ford GT Fuel Economy
The 2006 Ford GT can hold 17 gallons of fuel.
2006 Ford GT Specifications
The has a curb weight of 3,485 lbs. With an interior passenger volume of 52.8 cu. Ft.
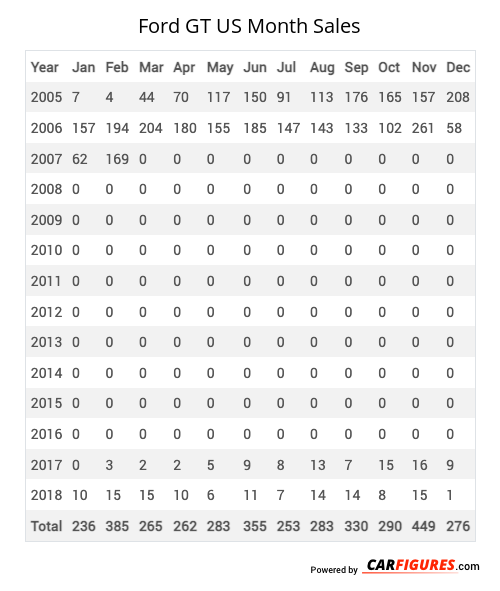
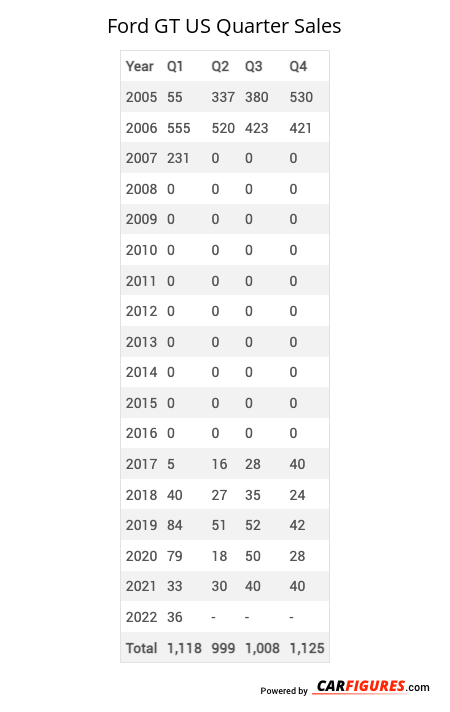
Ford GT United States Sale figures by year, quarter, and month are presented below. Including the most up to date sales data for the Ford GT. See how the Ford GT stacks up the other models in the Cars, Exotic Vehicles, Premium Sport/Performance Cars segments.
For sales numbers of the Ford GT in Canada, click here.
Loading, please wait
Year | Jan | Feb | Mar | Apr | May | Jun | Jul | Aug | Sep | Oct | Nov | Dec |
|---|---|---|---|---|---|---|---|---|---|---|---|---|
| 2005 | 7 | 4 | 44 | 70 | 117 | 150 | 91 | 113 | 176 | 165 | 157 | 208 |
| 2006 | 157 | 194 | 204 | 180 | 155 | 185 | 147 | 143 | 133 | 102 | 261 | 58 |
| 2007 | 62 | 169 | 0 | 0 | 0 | 0 | 0 | 0 | 0 | 0 | 0 | 0 |
| 2008 | 0 | 0 | 0 | 0 | 0 | 0 | 0 | 0 | 0 | 0 | 0 | 0 |
| 2009 | 0 | 0 | 0 | 0 | 0 | 0 | 0 | 0 | 0 | 0 | 0 | 0 |
| 2010 | 0 | 0 | 0 | 0 | 0 | 0 | 0 | 0 | 0 | 0 | 0 | 0 |
| 2011 | 0 | 0 | 0 | 0 | 0 | 0 | 0 | 0 | 0 | 0 | 0 | 0 |
| 2012 | 0 | 0 | 0 | 0 | 0 | 0 | 0 | 0 | 0 | 0 | 0 | 0 |
| 2013 | 0 | 0 | 0 | 0 | 0 | 0 | 0 | 0 | 0 | 0 | 0 | 0 |
| 2014 | 0 | 0 | 0 | 0 | 0 | 0 | 0 | 0 | 0 | 0 | 0 | 0 |
| 2015 | 0 | 0 | 0 | 0 | 0 | 0 | 0 | 0 | 0 | 0 | 0 | 0 |
| 2016 | 0 | 0 | 0 | 0 | 0 | 0 | 0 | 0 | 0 | 0 | 0 | 0 |
| 2017 | 0 | 3 | 2 | 2 | 5 | 9 | 8 | 13 | 7 | 15 | 16 | 9 |
| 2018 | 10 | 15 | 15 | 10 | 6 | 11 | 7 | 14 | 14 | 8 | 15 | 1 |
| Total | 236 | 385 | 265 | 262 | 283 | 355 | 253 | 283 | 330 | 290 | 449 | 276 |
Loading, please wait
Year | Q1 | Q2 | Q3 | Q4 |
|---|---|---|---|---|
| 2005 | 55 | 337 | 380 | 530 |
| 2006 | 555 | 520 | 423 | 421 |
| 2007 | 231 | 0 | 0 | 0 |
| 2008 | 0 | 0 | 0 | 0 |
| 2009 | 0 | 0 | 0 | 0 |
| 2010 | 0 | 0 | 0 | 0 |
| 2011 | 0 | 0 | 0 | 0 |
| 2012 | 0 | 0 | 0 | 0 |
| 2013 | 0 | 0 | 0 | 0 |
| 2014 | 0 | 0 | 0 | 0 |
| 2015 | 0 | 0 | 0 | 0 |
| 2016 | 0 | 0 | 0 | 0 |
| 2017 | 5 | 16 | 28 | 40 |
| 2018 | 40 | 27 | 35 | 24 |
| 2019 | 84 | 51 | 52 | 42 |
| 2020 | 79 | 18 | 50 | 28 |
| 2021 | 33 | 30 | 40 | 40 |
| 2022 | 36 | 22 | 17 | 14 |
| 2023 | 30 | 2 | 0 | 0 |
| 2024 | 0 | 0 | 0 | 0 |
| 2025 | - | - | - | - |
| Total | 1,148 | 1,023 | 1,025 | 1,139 |
Loading, please wait
Year | Sales |
|---|---|
| 2023 | 32 |
| 2022 | 89 |
| 2021 | 143 |
| 2020 | 175 |
| 2019 | 229 |
| 2018 | 126 |
| 2017 | 89 |
| 2016 | 0 |
| 2015 | 0 |
| 2014 | 0 |
| 2013 | 0 |
| 2012 | 0 |
| 2011 | 0 |
| 2010 | 0 |
| 2009 | 0 |
| 2008 | 0 |
| 2007 | 231 |
| 2006 | 1,919 |
| 2005 | 1,302 |
| Total | 4,335 |
Download Historic Sales Data

Embedded Code
See more widgetsSources: Manufacturers