Key Stats
How many Mustang did Ford sell in Q4 2024?
Ford sold 7,518 Mustang in Q4 2024.
How many Mustang did Ford sell in 2024?
Ford sold 37,485 Mustang in 2024. In 2023, Ford sold 50,557 Mustang. They sold 13,072 more units in year 2023 compared to 2024 with a percent loss of 25.86% YoY.
Overview
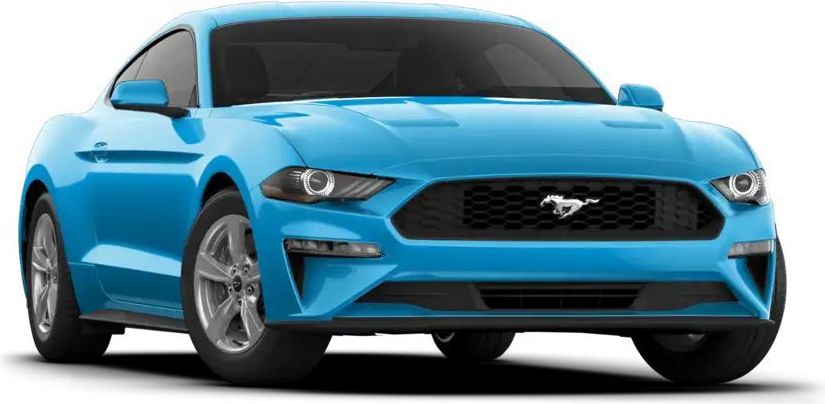
The 2024 Ford Mustang is a vehicle from automaker Ford.
How Much Does the 2024 Ford Mustang Cost?
The 2024 Ford Mustang starts at $30,920 MSRP. Fully loaded, the Ford Mustang will cost you about $57,970.
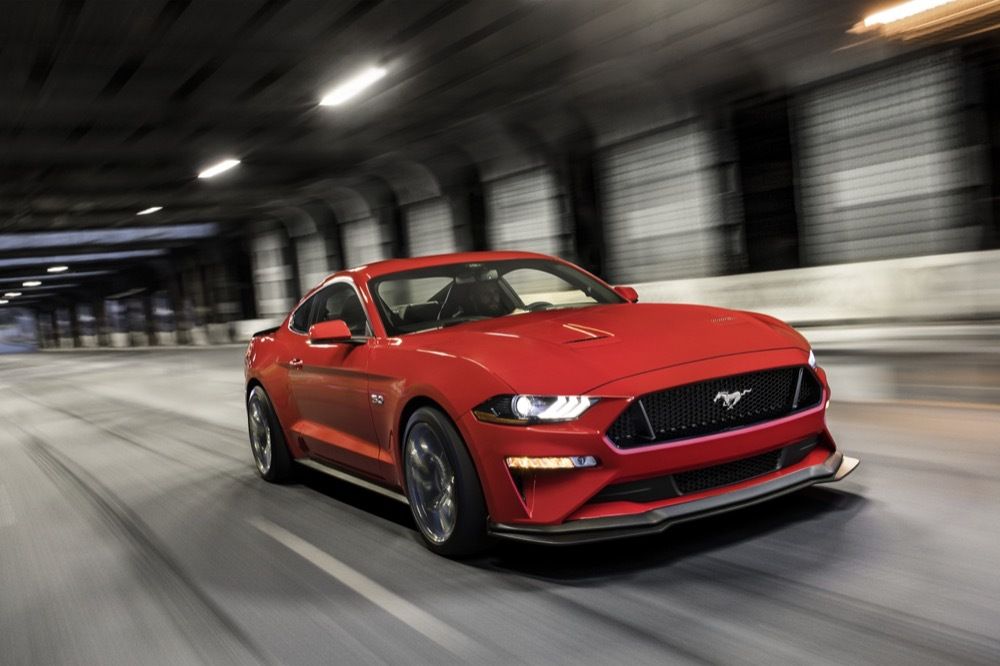
Ford Mustang Engine, Transmission, and Performance Numbers
The Ford Mustang includes a 2.3-liter coupled with a 10-Speed SelectShift Automatic that delivers 315 hp and 350 lb-ft torque with a Rear Wheel Drive drivetrain.
List of Ford Mustang Competitors
Some of Ford Mustang competitors include the Chevrolet Camaro, Dodge Challenger and BMW 2-Series.
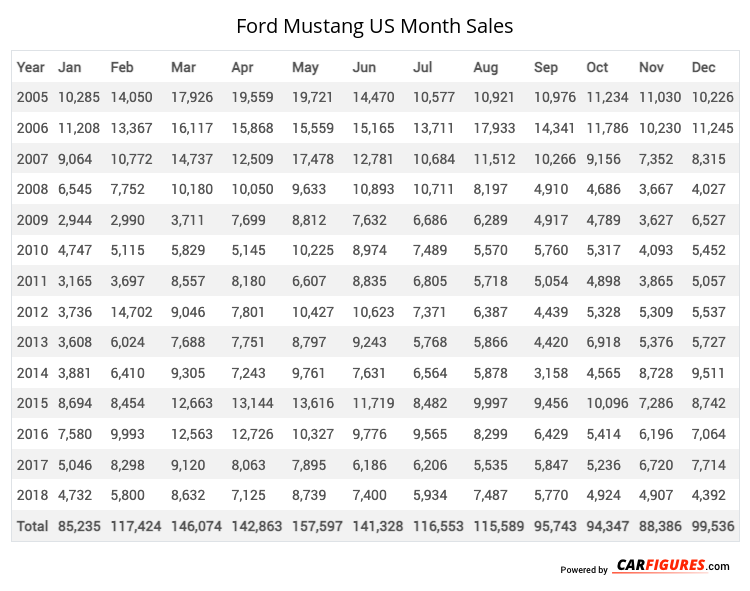
Ford Mustang United States Sale figures by year, quarter, and month are presented below. Including the most up to date sales data for the Ford Mustang. See how the Ford Mustang stacks up the other models in the Cars, Sport/Performance Cars segments.
Year | Jan | Feb | Mar | Apr | May | Jun | Jul | Aug | Sep | Oct | Nov | Dec |
|---|---|---|---|---|---|---|---|---|---|---|---|---|
| 2005 | 10,285 | 14,050 | 17,926 | 19,559 | 19,721 | 14,470 | 10,577 | 10,921 | 10,976 | 11,234 | 11,030 | 10,226 |
| 2006 | 11,208 | 13,367 | 16,117 | 15,868 | 15,559 | 15,165 | 13,711 | 17,933 | 14,341 | 11,786 | 10,230 | 11,245 |
| 2007 | 9,064 | 10,772 | 14,737 | 12,509 | 17,478 | 12,781 | 10,684 | 11,512 | 10,266 | 9,156 | 7,352 | 8,315 |
| 2008 | 6,545 | 7,752 | 10,180 | 10,050 | 9,633 | 10,893 | 10,711 | 8,197 | 4,910 | 4,686 | 3,667 | 4,027 |
| 2009 | 2,944 | 2,990 | 3,711 | 7,699 | 8,812 | 7,632 | 6,686 | 6,289 | 4,917 | 4,789 | 3,627 | 6,527 |
| 2010 | 4,747 | 5,115 | 5,829 | 5,145 | 10,225 | 8,974 | 7,489 | 5,570 | 5,760 | 5,317 | 4,093 | 5,452 |
| 2011 | 3,165 | 3,697 | 8,557 | 8,180 | 6,607 | 8,835 | 6,805 | 5,718 | 5,054 | 4,898 | 3,865 | 5,057 |
| 2012 | 3,736 | 14,702 | 9,046 | 7,801 | 10,427 | 10,623 | 7,371 | 6,387 | 4,439 | 5,328 | 5,309 | 5,537 |
| 2013 | 3,608 | 6,024 | 7,688 | 7,751 | 8,797 | 9,243 | 5,768 | 5,866 | 4,420 | 6,918 | 5,376 | 5,727 |
| 2014 | 3,881 | 6,410 | 9,305 | 7,243 | 9,761 | 7,631 | 6,564 | 5,878 | 3,158 | 4,565 | 8,728 | 9,511 |
| 2015 | 8,694 | 8,454 | 12,663 | 13,144 | 13,616 | 11,719 | 8,482 | 9,997 | 9,456 | 10,096 | 7,286 | 8,742 |
| 2016 | 7,580 | 9,993 | 12,563 | 12,726 | 10,327 | 9,776 | 9,565 | 8,299 | 6,429 | 5,414 | 6,196 | 7,064 |
| 2017 | 5,046 | 8,298 | 9,120 | 8,063 | 7,895 | 6,186 | 6,206 | 5,535 | 5,847 | 5,236 | 6,720 | 7,714 |
| 2018 | 4,732 | 5,800 | 8,632 | 7,125 | 8,739 | 7,400 | 5,934 | 7,487 | 5,770 | 4,924 | 4,907 | 4,392 |
| Total | 85,235 | 117,424 | 146,074 | 142,863 | 157,597 | 141,328 | 116,553 | 115,589 | 95,743 | 94,347 | 88,386 | 99,536 |
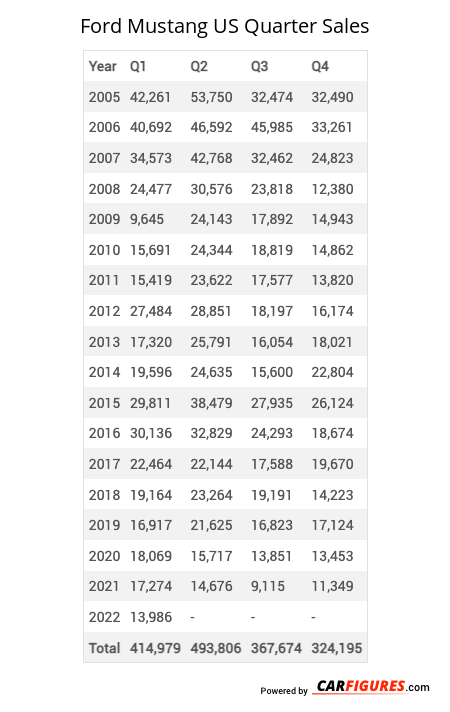
Year | Q1 | Q2 | Q3 | Q4 |
|---|---|---|---|---|
| 2005 | 42,261 | 53,750 | 32,474 | 32,490 |
| 2006 | 40,692 | 46,592 | 45,985 | 33,261 |
| 2007 | 34,573 | 42,768 | 32,462 | 24,823 |
| 2008 | 24,477 | 30,576 | 23,818 | 12,380 |
| 2009 | 9,645 | 24,143 | 17,892 | 14,943 |
| 2010 | 15,691 | 24,344 | 18,819 | 14,862 |
| 2011 | 15,419 | 23,622 | 17,577 | 13,820 |
| 2012 | 27,484 | 28,851 | 18,197 | 16,174 |
| 2013 | 17,320 | 25,791 | 16,054 | 18,021 |
| 2014 | 19,596 | 24,635 | 15,600 | 22,804 |
| 2015 | 29,811 | 38,479 | 27,935 | 26,124 |
| 2016 | 30,136 | 32,829 | 24,293 | 18,674 |
| 2017 | 22,464 | 22,144 | 17,588 | 19,670 |
| 2018 | 19,164 | 23,264 | 19,191 | 14,223 |
| 2019 | 16,917 | 21,625 | 16,823 | 17,124 |
| 2020 | 18,069 | 15,717 | 13,851 | 13,453 |
| 2021 | 17,274 | 14,676 | 9,115 | 11,349 |
| 2022 | 13,986 | 9,024 | 10,354 | 10,968 |
| 2023 | 19,265 | 19,460 | 3,269 | 8,563 |
| 2024 | 7,886 | 9,831 | 12,250 | 7,518 |
| Total | 442,130 | 532,121 | 393,547 | 351,244 |
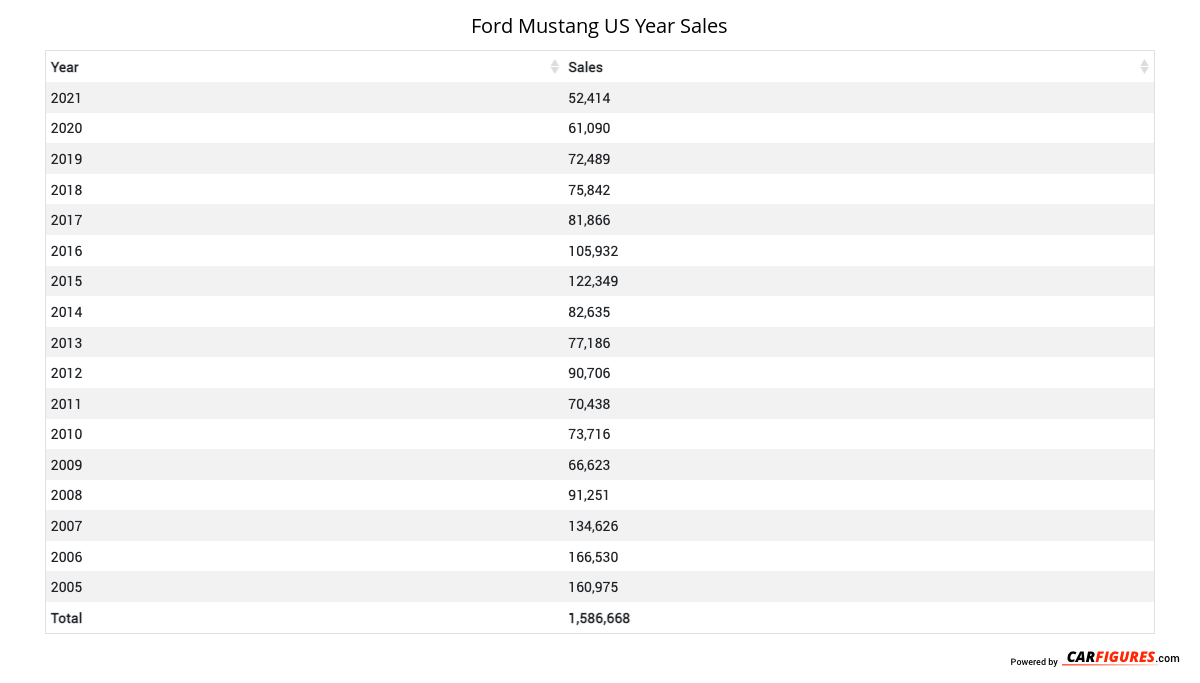
Year | Sales |
|---|---|
| 2024 | 37,485 |
| 2023 | 50,557 |
| 2022 | 44,332 |
| 2021 | 52,414 |
| 2020 | 61,090 |
| 2019 | 72,489 |
| 2018 | 75,842 |
| 2017 | 81,866 |
| 2016 | 105,932 |
| 2015 | 122,349 |
| 2014 | 82,635 |
| 2013 | 77,186 |
| 2012 | 90,706 |
| 2011 | 70,438 |
| 2010 | 73,716 |
| 2009 | 66,623 |
| 2008 | 91,251 |
| 2007 | 134,626 |
| 2006 | 166,530 |
| 2005 | 160,975 |
| Total | 1,719,042 |
Download Historic Sales Data
Embedded Code
See more widgetsSources: Manufacturers