Key Stats
How many Ranger did Ford sell in 2024?
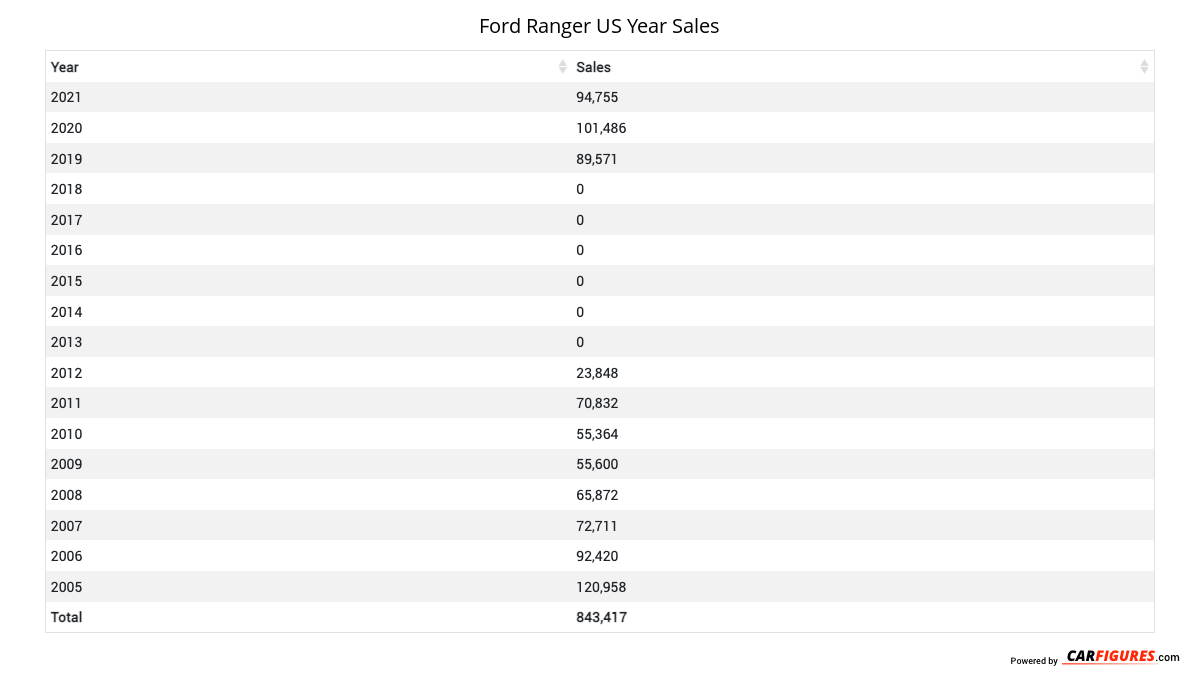
Ford sold 45,749 Ranger in 2024. In 2023, Ford sold 39,364 Ranger. They sold 6,385 more units in 2024 compared to 2023 with a percent gain of 16.22% YoY.
Overview
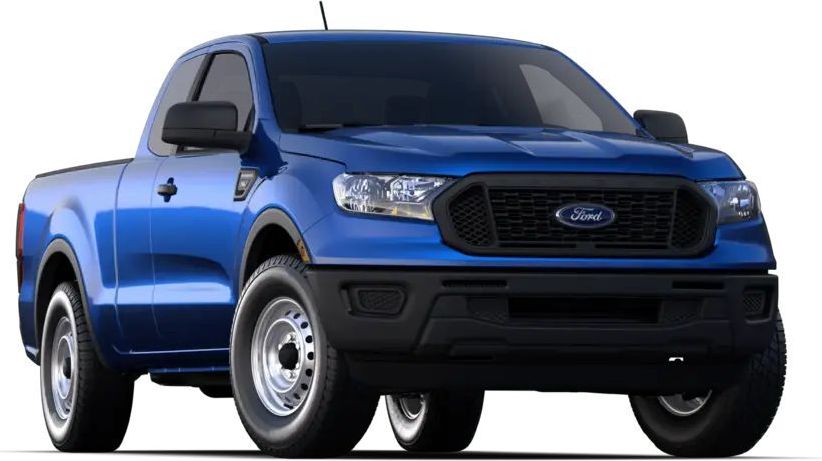
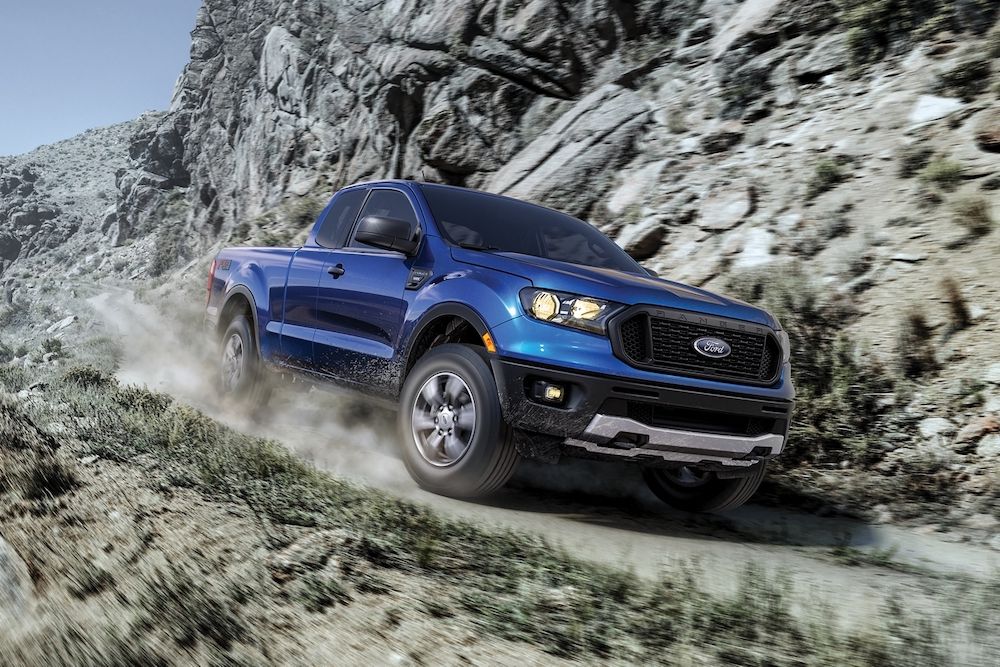
The 2024 Ford Ranger is a vehicle from automaker Ford.
How Much Does the 2024 Ford Ranger Cost?
Pricing for the 2024 Ford Ranger starts at $32,565 MSRP and goes up to $55,365 fully loaded.
Ford Ranger Engine, Transmission, and Performance Numbers
Ford Ranger includes a 2.3-liter engine combined with a Electronic 10-Speed Automatic (STD). This delivers 270 hp with 310 lb-ft torque delivered through a Rear Wheel Drive drivetrain.
List of Ford Ranger Competitors
Some of Ford Ranger competitors include the Chevrolet Colorado and Toyota Tacoma.
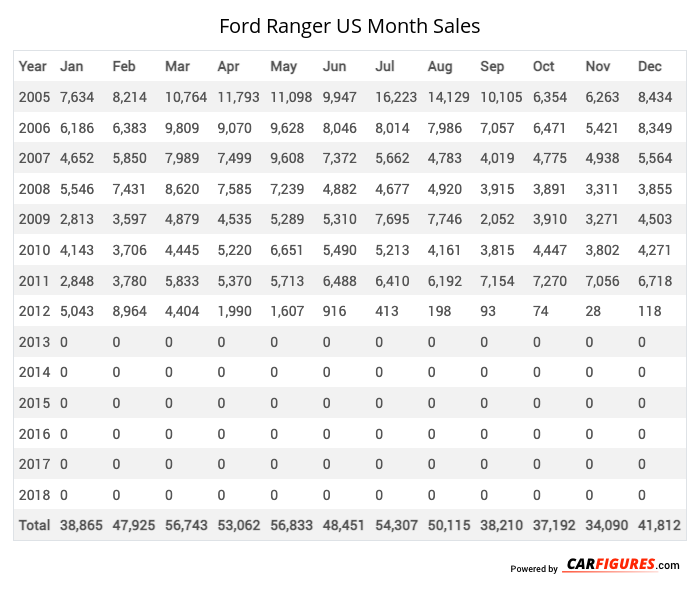
Ford Ranger United States Sale figures by year, quarter, and month are presented below. Including the most up to date sales data for the Ford Ranger. See how the Ford Ranger stacks up the other models in the Compact Pickup Trucks, Pickup Trucks segments.
Year | Jan | Feb | Mar | Apr | May | Jun | Jul | Aug | Sep | Oct | Nov | Dec |
|---|---|---|---|---|---|---|---|---|---|---|---|---|
| 2005 | 7,634 | 8,214 | 10,764 | 11,793 | 11,098 | 9,947 | 16,223 | 14,129 | 10,105 | 6,354 | 6,263 | 8,434 |
| 2006 | 6,186 | 6,383 | 9,809 | 9,070 | 9,628 | 8,046 | 8,014 | 7,986 | 7,057 | 6,471 | 5,421 | 8,349 |
| 2007 | 4,652 | 5,850 | 7,989 | 7,499 | 9,608 | 7,372 | 5,662 | 4,783 | 4,019 | 4,775 | 4,938 | 5,564 |
| 2008 | 5,546 | 7,431 | 8,620 | 7,585 | 7,239 | 4,882 | 4,677 | 4,920 | 3,915 | 3,891 | 3,311 | 3,855 |
| 2009 | 2,813 | 3,597 | 4,879 | 4,535 | 5,289 | 5,310 | 7,695 | 7,746 | 2,052 | 3,910 | 3,271 | 4,503 |
| 2010 | 4,143 | 3,706 | 4,445 | 5,220 | 6,651 | 5,490 | 5,213 | 4,161 | 3,815 | 4,447 | 3,802 | 4,271 |
| 2011 | 2,848 | 3,780 | 5,833 | 5,370 | 5,713 | 6,488 | 6,410 | 6,192 | 7,154 | 7,270 | 7,056 | 6,718 |
| 2012 | 5,043 | 8,964 | 4,404 | 1,990 | 1,607 | 916 | 413 | 198 | 93 | 74 | 28 | 118 |
| 2013 | 0 | 0 | 0 | 0 | 0 | 0 | 0 | 0 | 0 | 0 | 0 | 0 |
| 2014 | 0 | 0 | 0 | 0 | 0 | 0 | 0 | 0 | 0 | 0 | 0 | 0 |
| 2015 | 0 | 0 | 0 | 0 | 0 | 0 | 0 | 0 | 0 | 0 | 0 | 0 |
| 2016 | 0 | 0 | 0 | 0 | 0 | 0 | 0 | 0 | 0 | 0 | 0 | 0 |
| 2017 | 0 | 0 | 0 | 0 | 0 | 0 | 0 | 0 | 0 | 0 | 0 | 0 |
| 2018 | 0 | 0 | 0 | 0 | 0 | 0 | 0 | 0 | 0 | 0 | 0 | 0 |
| Total | 38,865 | 47,925 | 56,743 | 53,062 | 56,833 | 48,451 | 54,307 | 50,115 | 38,210 | 37,192 | 34,090 | 41,812 |
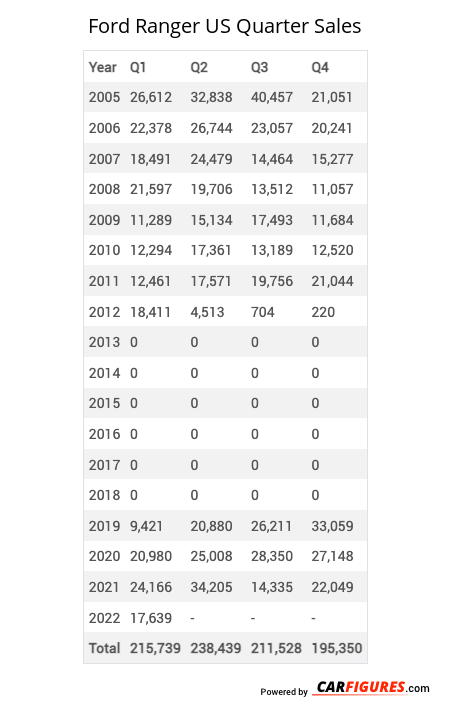
Year | Q1 | Q2 | Q3 | Q4 |
|---|---|---|---|---|
| 2005 | 26,612 | 32,838 | 40,457 | 21,051 |
| 2006 | 22,378 | 26,744 | 23,057 | 20,241 |
| 2007 | 18,491 | 24,479 | 14,464 | 15,277 |
| 2008 | 21,597 | 19,706 | 13,512 | 11,057 |
| 2009 | 11,289 | 15,134 | 17,493 | 11,684 |
| 2010 | 12,294 | 17,361 | 13,189 | 12,520 |
| 2011 | 12,461 | 17,571 | 19,756 | 21,044 |
| 2012 | 18,411 | 4,513 | 704 | 220 |
| 2013 | 0 | 0 | 0 | 0 |
| 2014 | 0 | 0 | 0 | 0 |
| 2015 | 0 | 0 | 0 | 0 |
| 2016 | 0 | 0 | 0 | 0 |
| 2017 | 0 | 0 | 0 | 0 |
| 2018 | 0 | 0 | 0 | 0 |
| 2019 | 9,421 | 20,880 | 26,211 | 33,059 |
| 2020 | 20,980 | 25,008 | 28,350 | 27,148 |
| 2021 | 24,166 | 34,205 | 14,335 | 22,049 |
| 2022 | 17,639 | 16,201 | 12,453 | 10,694 |
| 2023 | 11,500 | 20,821 | 6,384 | 659 |
| 2024 | 303 | 9,030 | 20,890 | 15,526 |
| 2025 | - | - | - | - |
| Total | 227,542 | 284,491 | 251,255 | 222,229 |
Year | Sales |
|---|---|
| 2024 | 45,749 |
| 2023 | 39,364 |
| 2022 | 56,987 |
| 2021 | 94,755 |
| 2020 | 101,486 |
| 2019 | 89,571 |
| 2018 | 0 |
| 2017 | 0 |
| 2016 | 0 |
| 2015 | 0 |
| 2014 | 0 |
| 2013 | 0 |
| 2012 | 23,848 |
| 2011 | 70,832 |
| 2010 | 55,364 |
| 2009 | 55,600 |
| 2008 | 65,872 |
| 2007 | 72,711 |
| 2006 | 92,420 |
| 2005 | 120,958 |
| Total | 985,517 |
Download Historic Sales Data
Embedded Code
See more widgetsSources: Manufacturers