
Key Stats
How many Edge did Ford sell in 2024?
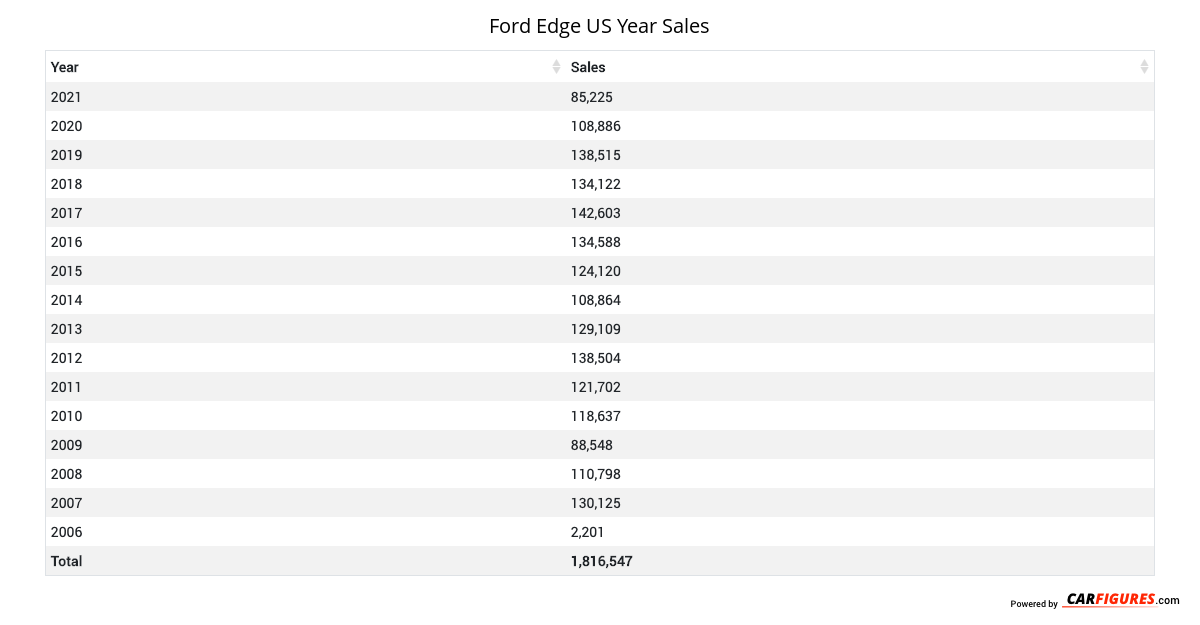
Ford sold 52,169 Edge in 2024. In 2023, Ford sold 102,049 Edge. They sold 49,880 more units in year 2023 compared to 2024 with a percent loss of 48.88% YoY.
Overview
The 2024 Ford Edge is a vehicle from automaker Ford.
How Much Does the 2024 Ford Edge Cost?
The 2024 Ford Edge starts at $38,365 MSRP. Fully loaded, the Ford Edge will cost you about $47,205.
Ford Edge Engine, Transmission, and Performance Numbers
Ford Edge includes a 2.0-liter engine combined with an 8-Speed Automatic. This delivers 250 hp with 275 lb-ft torque delivered through a All Wheel Drive drivetrain.
List of Ford Edge Competitors
Some of Ford Edge competitors include the Honda Passport and Ford Escape.
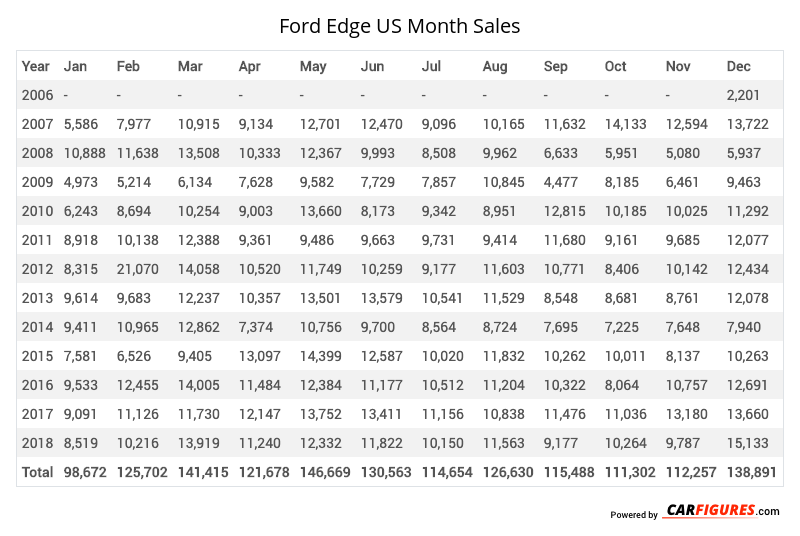
Ford Edge United States Sale figures by year, quarter, and month are presented below. Including the most up to date sales data for the Ford Edge. See how the Ford Edge stacks up the other models in the Crossover/SUVS, Midsize Crossover/SUVs segments.
Year | Jan | Feb | Mar | Apr | May | Jun | Jul | Aug | Sep | Oct | Nov | Dec |
|---|---|---|---|---|---|---|---|---|---|---|---|---|
| 2006 | - | - | - | - | - | - | - | - | - | - | - | 2,201 |
| 2007 | 5,586 | 7,977 | 10,915 | 9,134 | 12,701 | 12,470 | 9,096 | 10,165 | 11,632 | 14,133 | 12,594 | 13,722 |
| 2008 | 10,888 | 11,638 | 13,508 | 10,333 | 12,367 | 9,993 | 8,508 | 9,962 | 6,633 | 5,951 | 5,080 | 5,937 |
| 2009 | 4,973 | 5,214 | 6,134 | 7,628 | 9,582 | 7,729 | 7,857 | 10,845 | 4,477 | 8,185 | 6,461 | 9,463 |
| 2010 | 6,243 | 8,694 | 10,254 | 9,003 | 13,660 | 8,173 | 9,342 | 8,951 | 12,815 | 10,185 | 10,025 | 11,292 |
| 2011 | 8,918 | 10,138 | 12,388 | 9,361 | 9,486 | 9,663 | 9,731 | 9,414 | 11,680 | 9,161 | 9,685 | 12,077 |
| 2012 | 8,315 | 21,070 | 14,058 | 10,520 | 11,749 | 10,259 | 9,177 | 11,603 | 10,771 | 8,406 | 10,142 | 12,434 |
| 2013 | 9,614 | 9,683 | 12,237 | 10,357 | 13,501 | 13,579 | 10,541 | 11,529 | 8,548 | 8,681 | 8,761 | 12,078 |
| 2014 | 9,411 | 10,965 | 12,862 | 7,374 | 10,756 | 9,700 | 8,564 | 8,724 | 7,695 | 7,225 | 7,648 | 7,940 |
| 2015 | 7,581 | 6,526 | 9,405 | 13,097 | 14,399 | 12,587 | 10,020 | 11,832 | 10,262 | 10,011 | 8,137 | 10,263 |
| 2016 | 9,533 | 12,455 | 14,005 | 11,484 | 12,384 | 11,177 | 10,512 | 11,204 | 10,322 | 8,064 | 10,757 | 12,691 |
| 2017 | 9,091 | 11,126 | 11,730 | 12,147 | 13,752 | 13,411 | 11,156 | 10,838 | 11,476 | 11,036 | 13,180 | 13,660 |
| 2018 | 8,519 | 10,216 | 13,919 | 11,240 | 12,332 | 11,822 | 10,150 | 11,563 | 9,177 | 10,264 | 9,787 | 15,133 |
| Total | 98,672 | 125,702 | 141,415 | 121,678 | 146,669 | 130,563 | 114,654 | 126,630 | 115,488 | 111,302 | 112,257 | 138,891 |
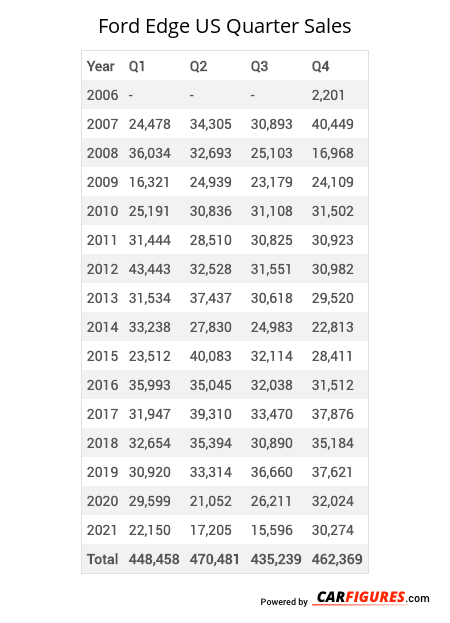
Year | Q1 | Q2 | Q3 | Q4 |
|---|---|---|---|---|
| 2006 | - | - | - | 2,201 |
| 2007 | 24,478 | 34,305 | 30,893 | 40,449 |
| 2008 | 36,034 | 32,693 | 25,103 | 16,968 |
| 2009 | 16,321 | 24,939 | 23,179 | 24,109 |
| 2010 | 25,191 | 30,836 | 31,108 | 31,502 |
| 2011 | 31,444 | 28,510 | 30,825 | 30,923 |
| 2012 | 43,443 | 32,528 | 31,551 | 30,982 |
| 2013 | 31,534 | 37,437 | 30,618 | 29,520 |
| 2014 | 33,238 | 27,830 | 24,983 | 22,813 |
| 2015 | 23,512 | 40,083 | 32,114 | 28,411 |
| 2016 | 35,993 | 35,045 | 32,038 | 31,512 |
| 2017 | 31,947 | 39,310 | 33,470 | 37,876 |
| 2018 | 32,654 | 35,394 | 30,890 | 35,184 |
| 2019 | 30,920 | 33,314 | 36,660 | 37,621 |
| 2020 | 29,599 | 21,052 | 26,211 | 32,024 |
| 2021 | 22,150 | 17,205 | 15,596 | 30,274 |
| 2022 | 0 | 25,041 | 16,170 | 17,842 |
| 2023 | 20,282 | 44,921 | 15,892 | 20,954 |
| 2024 | 20,765 | 12,666 | 13,714 | 5,024 |
| 2025 | - | - | - | - |
| Total | 489,505 | 553,109 | 481,015 | 506,189 |
Year | Sales |
|---|---|
| 2024 | 52,169 |
| 2023 | 102,049 |
| 2022 | 59,053 |
| 2021 | 85,225 |
| 2020 | 108,886 |
| 2019 | 138,515 |
| 2018 | 134,122 |
| 2017 | 142,603 |
| 2016 | 134,588 |
| 2015 | 124,120 |
| 2014 | 108,864 |
| 2013 | 129,109 |
| 2012 | 138,504 |
| 2011 | 121,702 |
| 2010 | 118,637 |
| 2009 | 88,548 |
| 2008 | 110,798 |
| 2007 | 130,125 |
| 2006 | 2,201 |
| Total | 2,029,818 |
Download Historic Sales Data
Embedded Code
See more widgetsSources: Manufacturers