Key Stats
How many Expedition did Ford sell in 2024?
Ford sold 69,331 Expedition in 2024. In 2023, Ford sold 73,689 Expedition. They sold 4,358 more units in year 2023 compared to 2024 with a percent loss of 5.91% YoY.
Overview
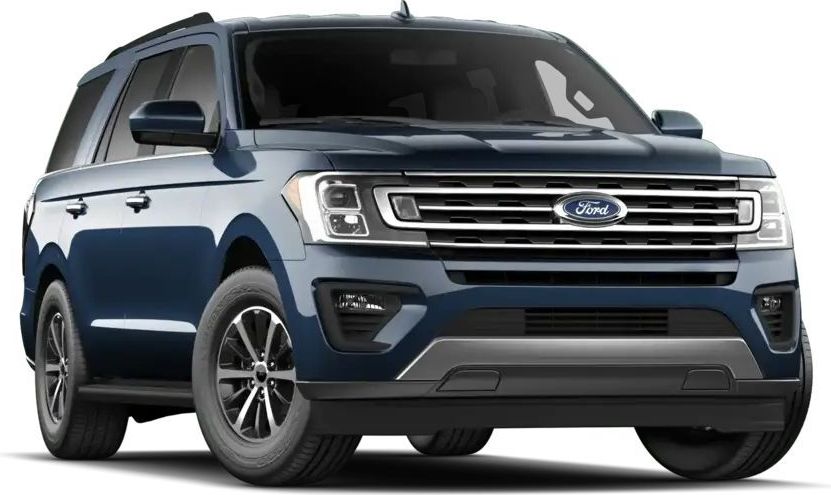
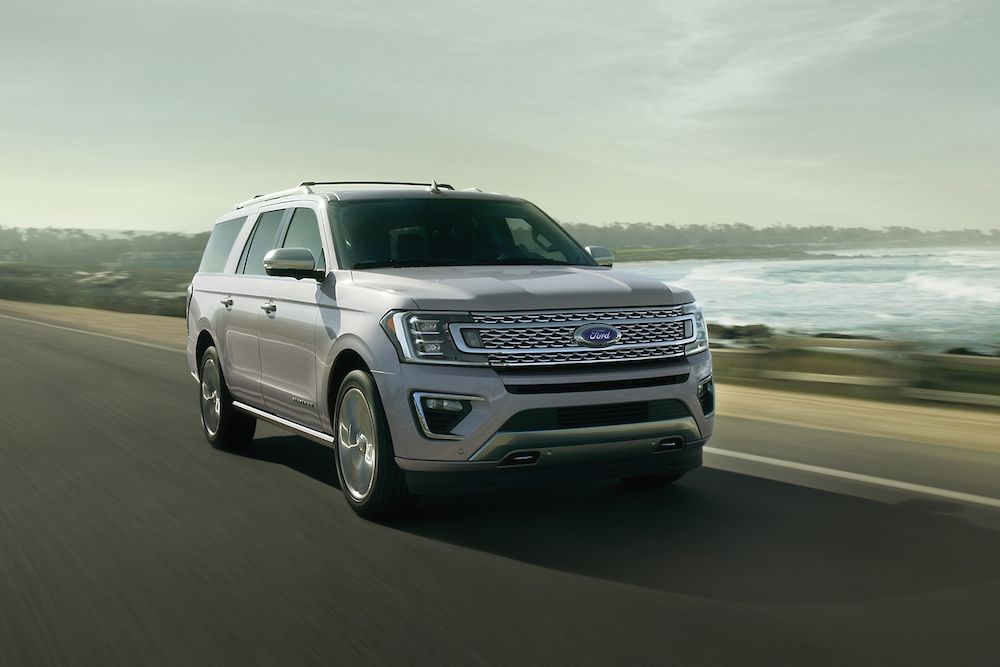
The 2024 Ford Expedition is a vehicle from automaker Ford.
How Much Does the 2024 Ford Expedition Cost?
The 2024 Ford Expedition starts at $55,105 MSRP. Fully loaded, the Ford Expedition will cost you about $84,545.
Ford Expedition Engine, Transmission, and Performance Numbers
Ford Expedition is powered by a 3.5-liter engine with a Rear Wheel Drive powertrain that makes 380 -hp and 470 lb-ft torque. The transmission on the Ford Expedition is an 10-Speed Automatic.
List of Ford Expedition Competitors
Some of Ford Expedition competitors include the Chevrolet Tahoe, Nissan Armada and Ford Explorer.
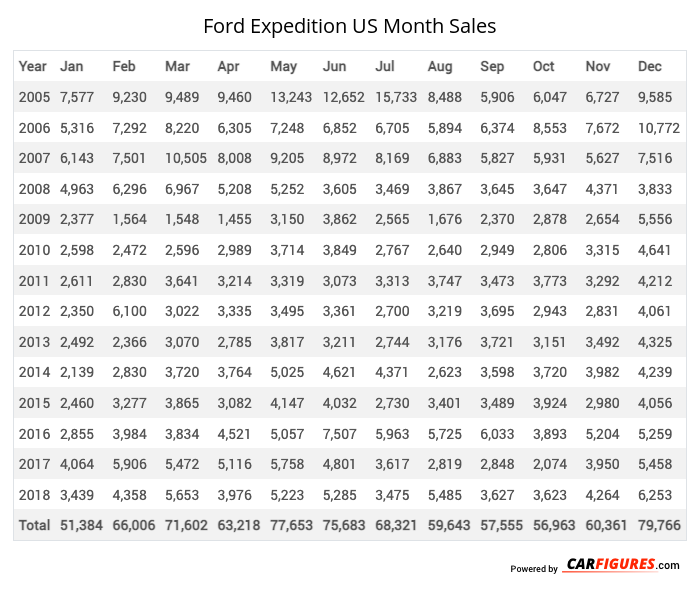
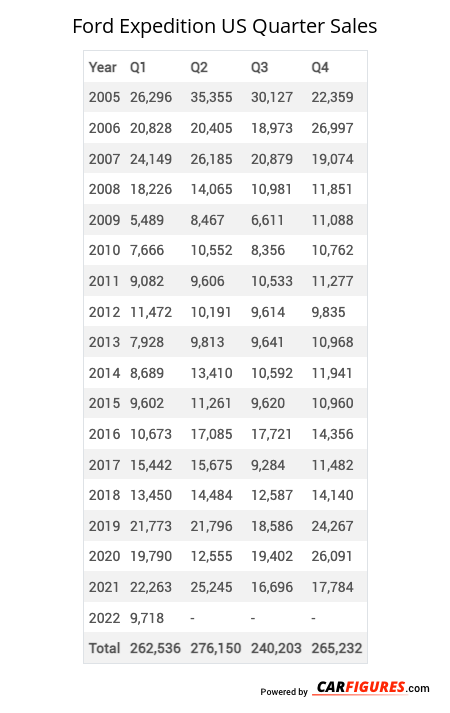
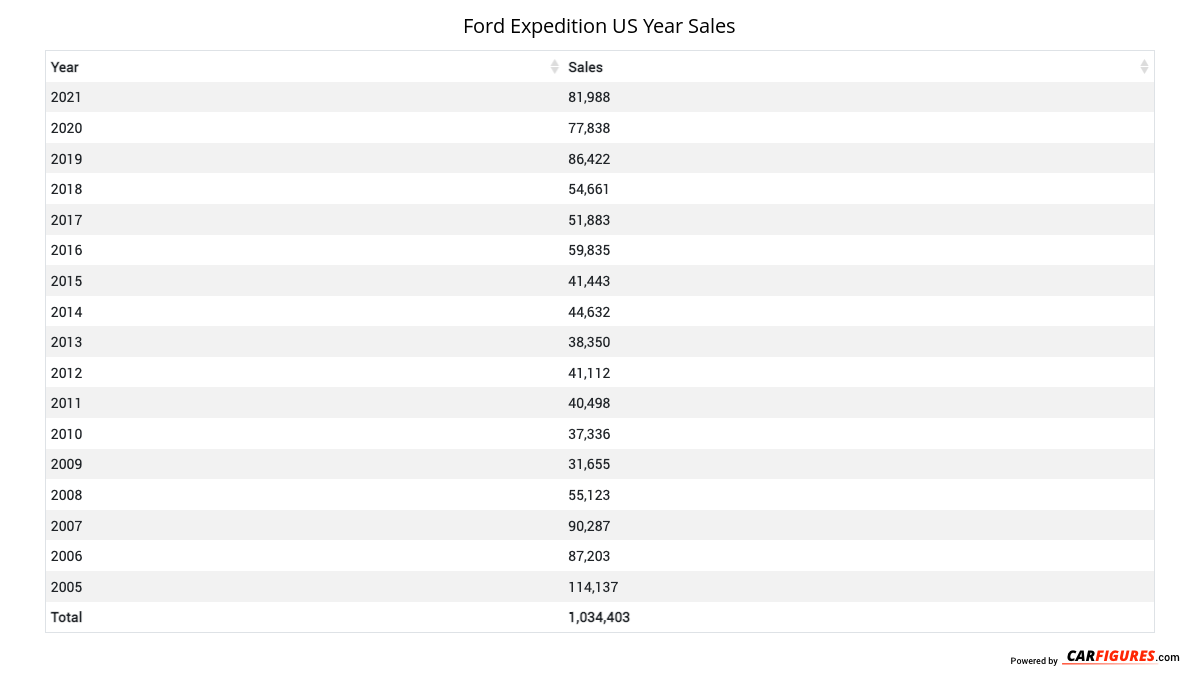
Ford Expedition United States Sale figures by year, quarter, and month are presented below. Including the most up to date sales data for the Ford Expedition. See how the Ford Expedition stacks up the other models in the Crossover/SUVS, Large SUVs segments.
Year | Jan | Feb | Mar | Apr | May | Jun | Jul | Aug | Sep | Oct | Nov | Dec |
|---|---|---|---|---|---|---|---|---|---|---|---|---|
| 2005 | 7,577 | 9,230 | 9,489 | 9,460 | 13,243 | 12,652 | 15,733 | 8,488 | 5,906 | 6,047 | 6,727 | 9,585 |
| 2006 | 5,316 | 7,292 | 8,220 | 6,305 | 7,248 | 6,852 | 6,705 | 5,894 | 6,374 | 8,553 | 7,672 | 10,772 |
| 2007 | 6,143 | 7,501 | 10,505 | 8,008 | 9,205 | 8,972 | 8,169 | 6,883 | 5,827 | 5,931 | 5,627 | 7,516 |
| 2008 | 4,963 | 6,296 | 6,967 | 5,208 | 5,252 | 3,605 | 3,469 | 3,867 | 3,645 | 3,647 | 4,371 | 3,833 |
| 2009 | 2,377 | 1,564 | 1,548 | 1,455 | 3,150 | 3,862 | 2,565 | 1,676 | 2,370 | 2,878 | 2,654 | 5,556 |
| 2010 | 2,598 | 2,472 | 2,596 | 2,989 | 3,714 | 3,849 | 2,767 | 2,640 | 2,949 | 2,806 | 3,315 | 4,641 |
| 2011 | 2,611 | 2,830 | 3,641 | 3,214 | 3,319 | 3,073 | 3,313 | 3,747 | 3,473 | 3,773 | 3,292 | 4,212 |
| 2012 | 2,350 | 6,100 | 3,022 | 3,335 | 3,495 | 3,361 | 2,700 | 3,219 | 3,695 | 2,943 | 2,831 | 4,061 |
| 2013 | 2,492 | 2,366 | 3,070 | 2,785 | 3,817 | 3,211 | 2,744 | 3,176 | 3,721 | 3,151 | 3,492 | 4,325 |
| 2014 | 2,139 | 2,830 | 3,720 | 3,764 | 5,025 | 4,621 | 4,371 | 2,623 | 3,598 | 3,720 | 3,982 | 4,239 |
| 2015 | 2,460 | 3,277 | 3,865 | 3,082 | 4,147 | 4,032 | 2,730 | 3,401 | 3,489 | 3,924 | 2,980 | 4,056 |
| 2016 | 2,855 | 3,984 | 3,834 | 4,521 | 5,057 | 7,507 | 5,963 | 5,725 | 6,033 | 3,893 | 5,204 | 5,259 |
| 2017 | 4,064 | 5,906 | 5,472 | 5,116 | 5,758 | 4,801 | 3,617 | 2,819 | 2,848 | 2,074 | 3,950 | 5,458 |
| 2018 | 3,439 | 4,358 | 5,653 | 3,976 | 5,223 | 5,285 | 3,475 | 5,485 | 3,627 | 3,623 | 4,264 | 6,253 |
| Total | 51,384 | 66,006 | 71,602 | 63,218 | 77,653 | 75,683 | 68,321 | 59,643 | 57,555 | 56,963 | 60,361 | 79,766 |
Year | Q1 | Q2 | Q3 | Q4 |
|---|---|---|---|---|
| 2005 | 26,296 | 35,355 | 30,127 | 22,359 |
| 2006 | 20,828 | 20,405 | 18,973 | 26,997 |
| 2007 | 24,149 | 26,185 | 20,879 | 19,074 |
| 2008 | 18,226 | 14,065 | 10,981 | 11,851 |
| 2009 | 5,489 | 8,467 | 6,611 | 11,088 |
| 2010 | 7,666 | 10,552 | 8,356 | 10,762 |
| 2011 | 9,082 | 9,606 | 10,533 | 11,277 |
| 2012 | 11,472 | 10,191 | 9,614 | 9,835 |
| 2013 | 7,928 | 9,813 | 9,641 | 10,968 |
| 2014 | 8,689 | 13,410 | 10,592 | 11,941 |
| 2015 | 9,602 | 11,261 | 9,620 | 10,960 |
| 2016 | 10,673 | 17,085 | 17,721 | 14,356 |
| 2017 | 15,442 | 15,675 | 9,284 | 11,482 |
| 2018 | 13,450 | 14,484 | 12,587 | 14,140 |
| 2019 | 21,773 | 21,796 | 18,586 | 24,267 |
| 2020 | 19,790 | 12,555 | 19,402 | 26,091 |
| 2021 | 22,263 | 25,245 | 16,696 | 17,784 |
| 2022 | 9,718 | 13,129 | 18,760 | 20,400 |
| 2023 | 19,359 | 33,044 | 11,676 | 9,610 |
| 2024 | 13,845 | 15,775 | 19,800 | 19,911 |
| 2025 | - | - | - | - |
| Total | 295,740 | 338,098 | 290,439 | 315,153 |
Year | Sales |
|---|---|
| 2024 | 69,331 |
| 2023 | 73,689 |
| 2022 | 62,007 |
| 2021 | 81,988 |
| 2020 | 77,838 |
| 2019 | 86,422 |
| 2018 | 54,661 |
| 2017 | 51,883 |
| 2016 | 59,835 |
| 2015 | 41,443 |
| 2014 | 44,632 |
| 2013 | 38,350 |
| 2012 | 41,112 |
| 2011 | 40,498 |
| 2010 | 37,336 |
| 2009 | 31,655 |
| 2008 | 55,123 |
| 2007 | 90,287 |
| 2006 | 87,203 |
| 2005 | 114,137 |
| Total | 1,239,430 |
Download Historic Sales Data
Embedded Code
See more widgetsSources: Manufacturers