Key Stats
How many HR-V did Honda sell in 2022?
Honda sold 1,416 HR-V in 2022. (From Jan - Feb 2022)
How many HR-V did Honda sell in February 2022?
Honda sold 741 HR-V in February 2022.
How many HR-V did Honda sell in 2021?
Honda sold 11,616 HR-V in 2021. In 2020, Honda sold 10,306 HR-V. They sold 1,310 more units in 2021 compared to 2020 with a percent gain of 12.71% YoY.
Overview
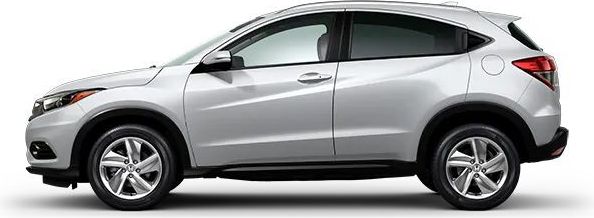
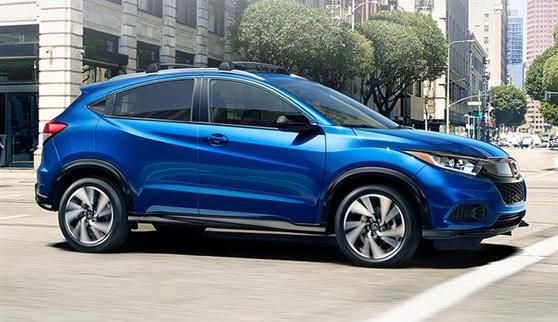
The 2022 Honda HR-V is a vehicle from automaker Honda.
How Much Does the 2022 Honda HR-V Cost?
The 2022 Honda HR-V starts at $25,705 MSRP. Fully loaded, the Honda HR-V will cost you about $34,205.
Honda HR-V Engine, Transmission, and Performance Numbers
Honda HR-V delivers 141 horsepower with 127 ft-lb torque delivered through a front-wheel-drive drivetrain.
List of Honda HR-V Competitors
Some of Honda HR-V competitors include the Kia Niro, Nissan Qashqai, Mazda CX-3, Hyundai Tucson, Kia Seltos, Kia Sportage, Mazda CX-30, Nissan Qashqai, Subaru Crosstrek, Toyota Corolla Cross, Nissan Qashqai and Hyundai Kona.
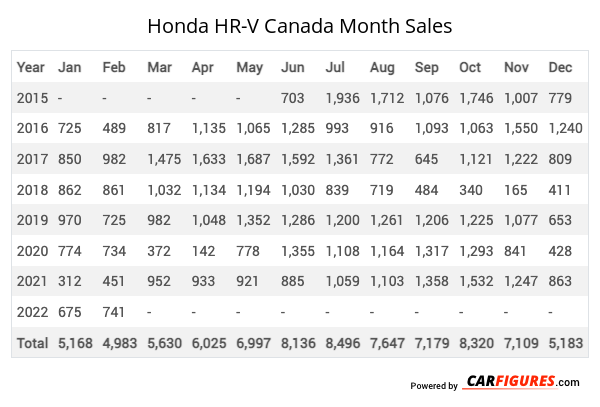
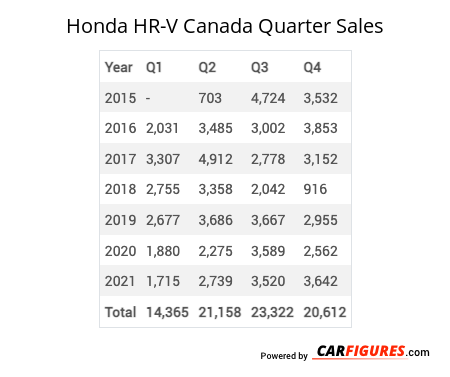
Honda HR-V Canadian Sale figures by year, quarter, and month are presented below. Including the most up to date sales data for the Honda HR-V. See how the Honda HR-V stacks up the other models in the Crossover/SUVS, Subcompact Crossover/SUVs segments.
Year | Jan | Feb | Mar | Apr | May | Jun | Jul | Aug | Sep | Oct | Nov | Dec |
|---|---|---|---|---|---|---|---|---|---|---|---|---|
| 2015 | - | - | - | - | - | 703 | 1,936 | 1,712 | 1,076 | 1,746 | 1,007 | 779 |
| 2016 | 725 | 489 | 817 | 1,135 | 1,065 | 1,285 | 993 | 916 | 1,093 | 1,063 | 1,550 | 1,240 |
| 2017 | 850 | 982 | 1,475 | 1,633 | 1,687 | 1,592 | 1,361 | 772 | 645 | 1,121 | 1,222 | 809 |
| 2018 | 862 | 861 | 1,032 | 1,134 | 1,194 | 1,030 | 839 | 719 | 484 | 340 | 165 | 411 |
| 2019 | 970 | 725 | 982 | 1,048 | 1,352 | 1,286 | 1,200 | 1,261 | 1,206 | 1,225 | 1,077 | 653 |
| 2020 | 774 | 734 | 372 | 142 | 778 | 1,355 | 1,108 | 1,164 | 1,317 | 1,293 | 841 | 428 |
| 2021 | 312 | 451 | 952 | 933 | 921 | 885 | 1,059 | 1,103 | 1,358 | 1,532 | 1,247 | 863 |
| 2022 | 675 | 741 | - | - | - | - | - | - | - | - | - | - |
| Total | 5,168 | 4,983 | 5,630 | 6,025 | 6,997 | 8,136 | 8,496 | 7,647 | 7,179 | 8,320 | 7,109 | 5,183 |
Year | Q1 | Q2 | Q3 | Q4 |
|---|---|---|---|---|
| 2015 | - | 703 | 4,724 | 3,532 |
| 2016 | 2,031 | 3,485 | 3,002 | 3,853 |
| 2017 | 3,307 | 4,912 | 2,778 | 3,152 |
| 2018 | 2,755 | 3,358 | 2,042 | 916 |
| 2019 | 2,677 | 3,686 | 3,667 | 2,955 |
| 2020 | 1,880 | 2,275 | 3,589 | 2,562 |
| 2021 | 1,715 | 2,739 | 3,520 | 3,642 |
| Total | 14,365 | 21,158 | 23,322 | 20,612 |
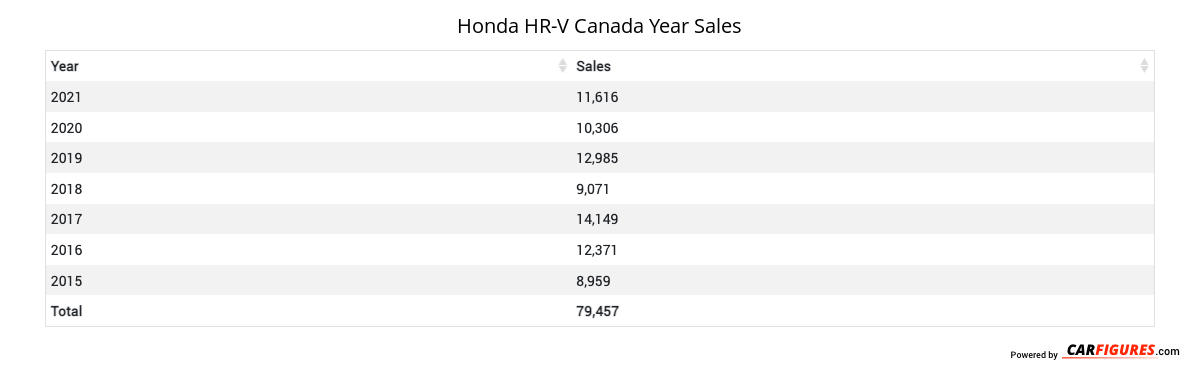
Year | Sales |
|---|---|
| 2021 | 11,616 |
| 2020 | 10,306 |
| 2019 | 12,985 |
| 2018 | 9,071 |
| 2017 | 14,149 |
| 2016 | 12,371 |
| 2015 | 8,959 |
| Total | 79,457 |
Download Historic Sales Data
Embedded Code
See more widgetsSources: Manufacturers