Key Stats
How many Insight did Honda sell in 2022?
Honda sold 2 Insight in 2022. (From Jan - Feb 2022)
How many Insight did Honda sell in February 2022?
Honda sold 1 Insight in February 2022.
How many Insight did Honda sell in 2021?
Honda sold 251 Insight in 2021. In 2020, Honda sold 415 Insight. They sold 164 more units in year 2020 compared to 2021 with a percent loss of 39.52% YoY.
Overview
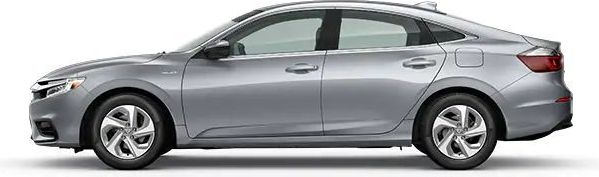
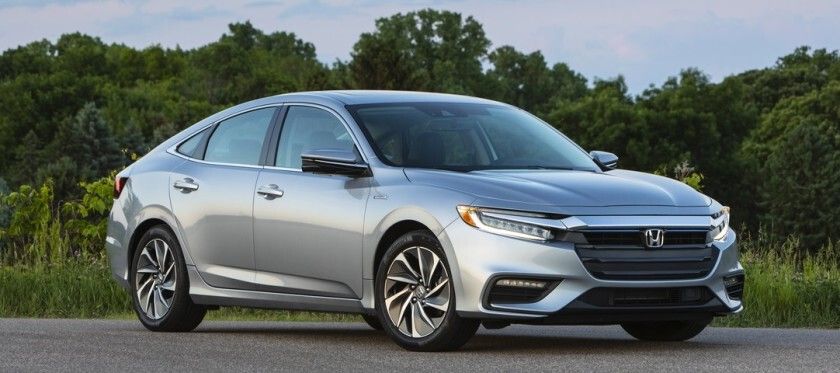
The 2021 Honda Insight is a vehicle from automaker Honda.
How Much Does the 2021 Honda Insight Cost?
Pricing for the 2021 Honda Insight starts at $28,490 MSRP and goes up to $32,190 fully loaded.
Honda Insight Engine, Transmission, and Performance Numbers
Honda Insight is powered by a front-wheel-drive powertrain that makes 151 horsepower and 99 ft-lb torque.
List of Honda Insight Competitors
Some of Honda Insight competitors include the Toyota Camry, Toyota Corolla, Nissan Altima, Mazda Mazda6, Subaru Impreza, Hyundai Elantra, Toyota Camry, Toyota Camry, Kia Forte and Nissan Sentra.
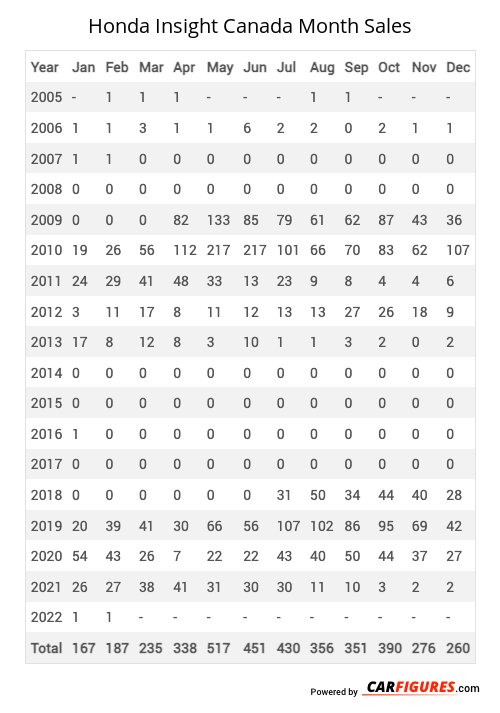
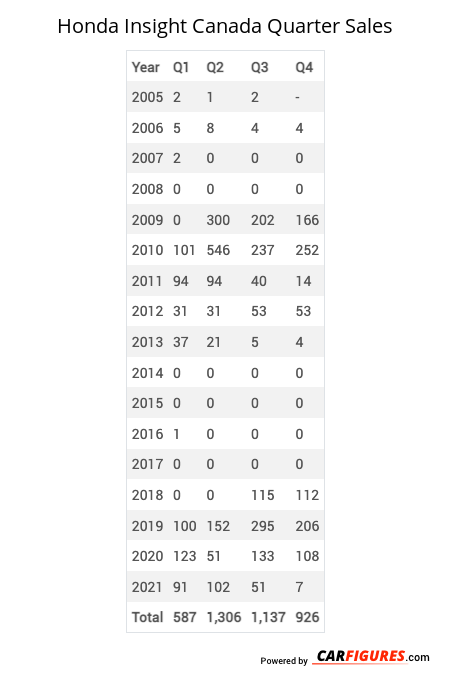
Honda Insight Canadian Sale figures by year, quarter, and month are presented below. Including the most up to date sales data for the Honda Insight. See how the Honda Insight stacks up the other models in the Cars, Compact Cars, Electric Vehicles segments.
Year | Jan | Feb | Mar | Apr | May | Jun | Jul | Aug | Sep | Oct | Nov | Dec |
|---|---|---|---|---|---|---|---|---|---|---|---|---|
| 2005 | - | 1 | 1 | 1 | - | - | - | 1 | 1 | - | - | - |
| 2006 | 1 | 1 | 3 | 1 | 1 | 6 | 2 | 2 | 0 | 2 | 1 | 1 |
| 2007 | 1 | 1 | 0 | 0 | 0 | 0 | 0 | 0 | 0 | 0 | 0 | 0 |
| 2008 | 0 | 0 | 0 | 0 | 0 | 0 | 0 | 0 | 0 | 0 | 0 | 0 |
| 2009 | 0 | 0 | 0 | 82 | 133 | 85 | 79 | 61 | 62 | 87 | 43 | 36 |
| 2010 | 19 | 26 | 56 | 112 | 217 | 217 | 101 | 66 | 70 | 83 | 62 | 107 |
| 2011 | 24 | 29 | 41 | 48 | 33 | 13 | 23 | 9 | 8 | 4 | 4 | 6 |
| 2012 | 3 | 11 | 17 | 8 | 11 | 12 | 13 | 13 | 27 | 26 | 18 | 9 |
| 2013 | 17 | 8 | 12 | 8 | 3 | 10 | 1 | 1 | 3 | 2 | 0 | 2 |
| 2014 | 0 | 0 | 0 | 0 | 0 | 0 | 0 | 0 | 0 | 0 | 0 | 0 |
| 2015 | 0 | 0 | 0 | 0 | 0 | 0 | 0 | 0 | 0 | 0 | 0 | 0 |
| 2016 | 1 | 0 | 0 | 0 | 0 | 0 | 0 | 0 | 0 | 0 | 0 | 0 |
| 2017 | 0 | 0 | 0 | 0 | 0 | 0 | 0 | 0 | 0 | 0 | 0 | 0 |
| 2018 | 0 | 0 | 0 | 0 | 0 | 0 | 31 | 50 | 34 | 44 | 40 | 28 |
| 2019 | 20 | 39 | 41 | 30 | 66 | 56 | 107 | 102 | 86 | 95 | 69 | 42 |
| 2020 | 54 | 43 | 26 | 7 | 22 | 22 | 43 | 40 | 50 | 44 | 37 | 27 |
| 2021 | 26 | 27 | 38 | 41 | 31 | 30 | 30 | 11 | 10 | 3 | 2 | 2 |
| 2022 | 1 | 1 | - | - | - | - | - | - | - | - | - | - |
| Total | 167 | 187 | 235 | 338 | 517 | 451 | 430 | 356 | 351 | 390 | 276 | 260 |
Year | Q1 | Q2 | Q3 | Q4 |
|---|---|---|---|---|
| 2005 | 2 | 1 | 2 | - |
| 2006 | 5 | 8 | 4 | 4 |
| 2007 | 2 | 0 | 0 | 0 |
| 2008 | 0 | 0 | 0 | 0 |
| 2009 | 0 | 300 | 202 | 166 |
| 2010 | 101 | 546 | 237 | 252 |
| 2011 | 94 | 94 | 40 | 14 |
| 2012 | 31 | 31 | 53 | 53 |
| 2013 | 37 | 21 | 5 | 4 |
| 2014 | 0 | 0 | 0 | 0 |
| 2015 | 0 | 0 | 0 | 0 |
| 2016 | 1 | 0 | 0 | 0 |
| 2017 | 0 | 0 | 0 | 0 |
| 2018 | 0 | 0 | 115 | 112 |
| 2019 | 100 | 152 | 295 | 206 |
| 2020 | 123 | 51 | 133 | 108 |
| 2021 | 91 | 102 | 51 | 7 |
| Total | 587 | 1,306 | 1,137 | 926 |
Year | Sales |
|---|---|
| 2021 | 251 |
| 2020 | 415 |
| 2019 | 753 |
| 2018 | 227 |
| 2017 | 0 |
| 2016 | 1 |
| 2015 | 0 |
| 2014 | 0 |
| 2013 | 67 |
| 2012 | 168 |
| 2011 | 242 |
| 2010 | 1,136 |
| 2009 | 668 |
| 2008 | 0 |
| 2007 | 2 |
| 2006 | 21 |
| 2005 | 5 |
| Total | 3,956 |
Download Historic Sales Data

Embedded Code
See more widgetsSources: Manufacturers