Key Stats
How many CX-3 did Mazda sell in 2022?
Mazda sold 973 CX-3 in 2022. (From Jan - Feb 2022)
How many CX-3 did Mazda sell in February 2022?
Mazda sold 550 CX-3 in February 2022.
How many CX-3 did Mazda sell in 2021?
Mazda sold 5,314 CX-3 in 2021. In 2020, Mazda sold 5,565 CX-3. They sold 251 more units in year 2020 compared to 2021 with a percent loss of 4.51% YoY.
Overview
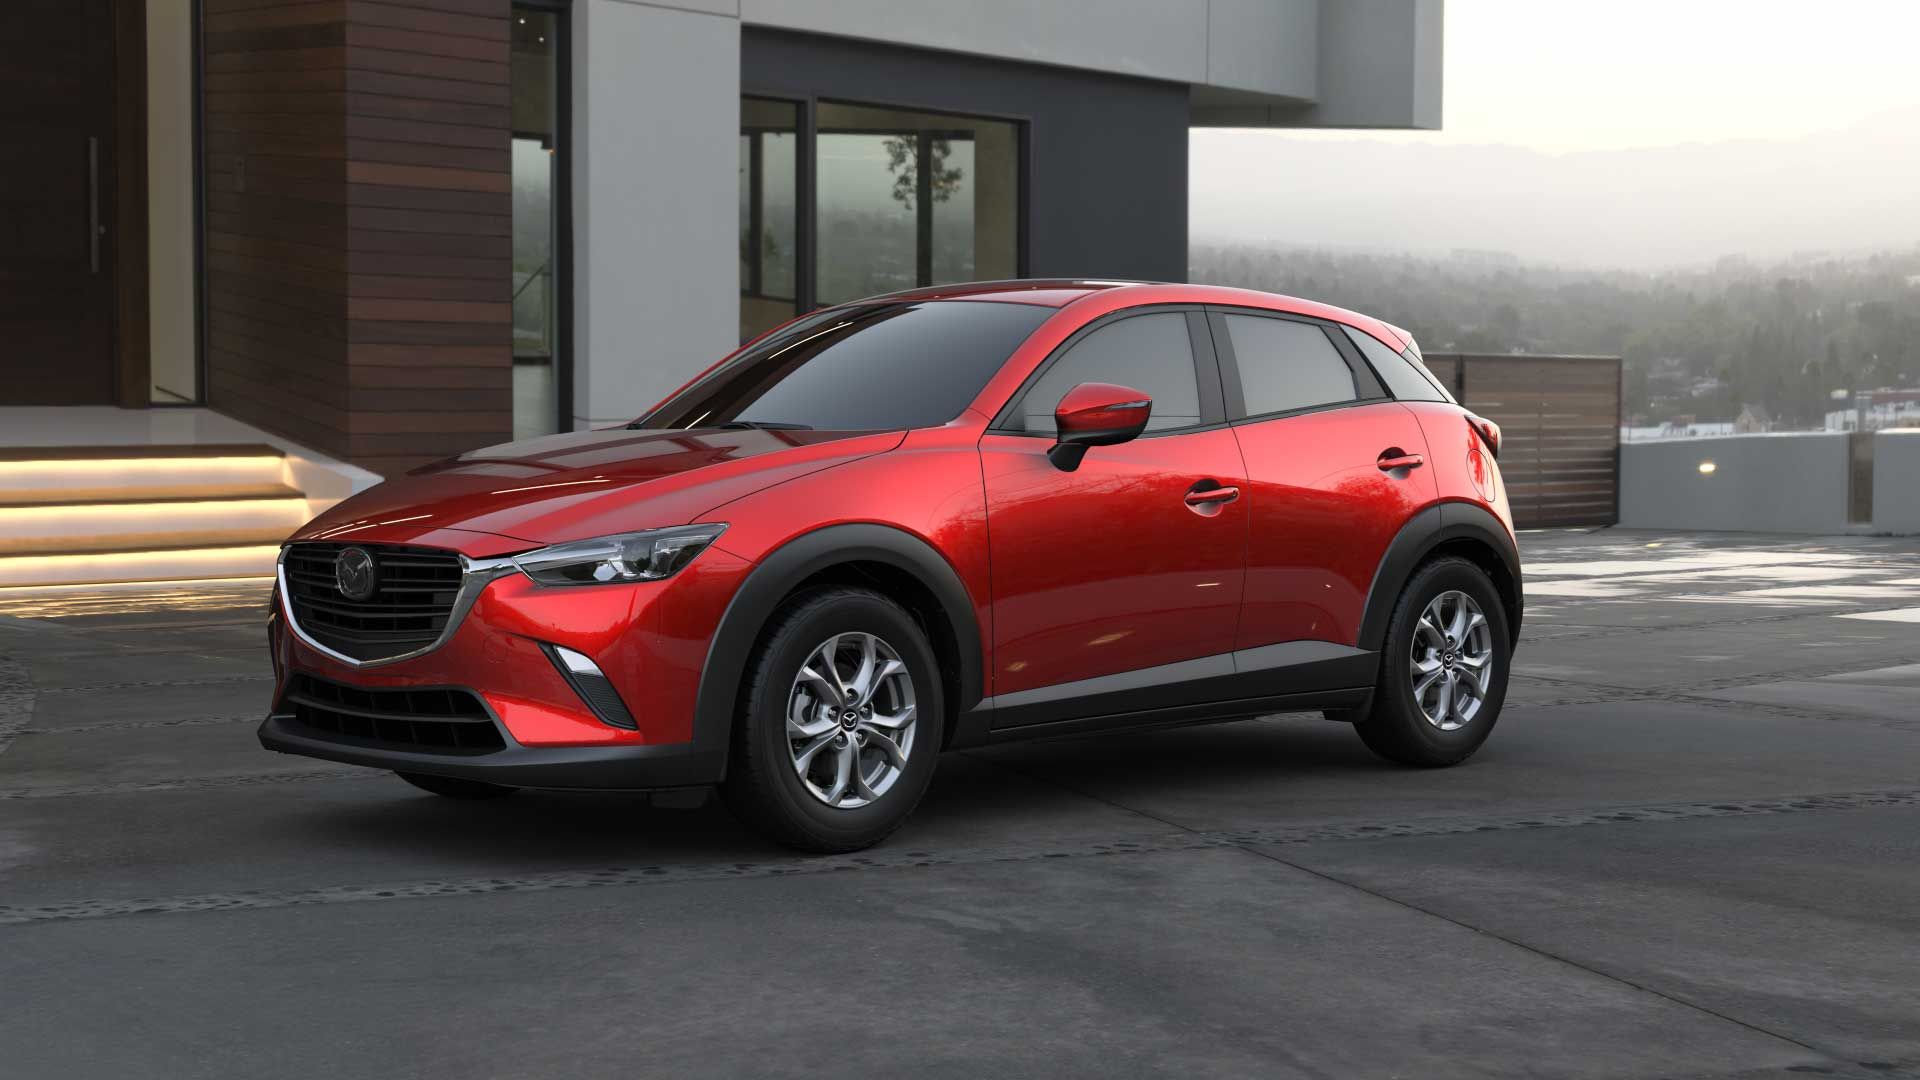
The 2022 Mazda CX-3 is a vehicle from automaker Mazda.
How Much Does the 2022 Mazda CX-3 Cost?
The 2022 Mazda CX-3 starts at $21,800 MSRP. Fully loaded, the Mazda CX-3 will cost you about $31,800.
Mazda CX-3 Engine, Transmission, and Performance Numbers
Mazda CX-3 is powered by a front-wheel-drive powertrain that makes 148 horsepower and 146 ft-lb torque.
List of Mazda CX-3 Competitors
Some of Mazda CX-3 competitors include the Toyota C-HR, Honda HR-V, Toyota C-HR, Nissan Kicks, Hyundai Kona, Kia Seltos, Subaru Crosstrek, Toyota C-HR, Toyota Corolla Cross and Kia Sportage.
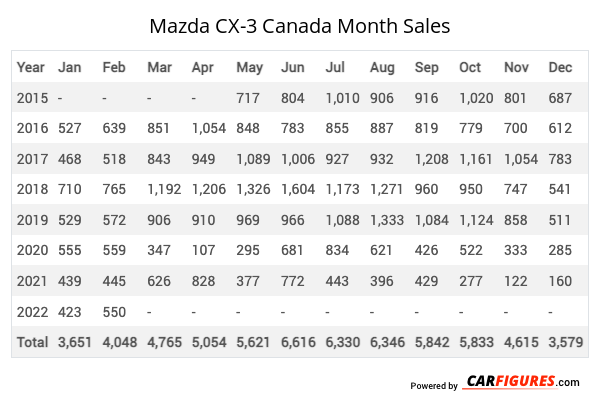
Mazda CX-3 Canadian Sale figures by year, quarter, and month are presented below. Including the most up to date sales data for the Mazda CX-3. See how the Mazda CX-3 stacks up the other models in the Crossover/SUVS, Subcompact Crossover/SUVs segments.
| Year | Jan | Feb | Mar | Apr | May | Jun | Jul | Aug | Sep | Oct | Nov | Dec |
|---|---|---|---|---|---|---|---|---|---|---|---|---|
| 2015 | - | - | - | - | 717 | 804 | 1010 | 906 | 916 | 1020 | 801 | 687 |
| 2016 | 527 | 639 | 851 | 1054 | 848 | 783 | 855 | 887 | 819 | 779 | 700 | 612 |
| 2017 | 468 | 518 | 843 | 949 | 1089 | 1006 | 927 | 932 | 1208 | 1161 | 1054 | 783 |
| 2018 | 710 | 765 | 1192 | 1206 | 1326 | 1604 | 1173 | 1271 | 960 | 950 | 747 | 541 |
| 2019 | 529 | 572 | 906 | 910 | 969 | 966 | 1088 | 1333 | 1084 | 1124 | 858 | 511 |
| 2020 | 555 | 559 | 347 | 107 | 295 | 681 | 834 | 621 | 426 | 522 | 333 | 285 |
| 2021 | 439 | 445 | 626 | 828 | 377 | 772 | 443 | 396 | 429 | 277 | 122 | 160 |
| 2022 | 423 | 550 | - | - | - | - | - | - | - | - | - | - |
| Total | 3651 | 4048 | 4765 | 5054 | 5621 | 6616 | 6330 | 6346 | 5842 | 5833 | 4615 | 3579 |
| Year | Q1 | Q2 | Q3 | Q4 |
|---|---|---|---|---|
| 2015 | - | 1521 | 2832 | 2508 |
| 2016 | 2017 | 2685 | 2561 | 2091 |
| 2017 | 1829 | 3044 | 3067 | 2998 |
| 2018 | 2667 | 4136 | 3404 | 2238 |
| 2019 | 2007 | 2845 | 3505 | 2493 |
| 2020 | 1461 | 1083 | 1881 | 1140 |
| 2021 | 1510 | 1977 | 1268 | 559 |
| Total | 11491 | 17291 | 18518 | 14027 |
| Year | Sales |
|---|---|
| 2021 | 5314 |
| 2020 | 5565 |
| 2019 | 10850 |
| 2018 | 12445 |
| 2017 | 10938 |
| 2016 | 9354 |
| 2015 | 6861 |
| Total | 61327 |
Download Historic Sales Data
Looking for more data/visualizations? Send us an email at [email protected] for customized data aggregates and visualizations.Embedded Code
See more widgetsSources: Manufacturers


