Key Stats
How many Impreza did Subaru sell in 2025?
Subaru sold 5,478 Impreza in 2025. (From Jan - Mar 2025)
How many Impreza did Subaru sell in March 2025?
Subaru sold 3,049 Impreza in March 2025.
How many Impreza did Subaru sell in 2024?
Subaru sold 31,366 Impreza in 2024. In 2023, Subaru sold 34,719 Impreza. They sold 3,353 more units in year 2023 compared to 2024 with a percent loss of 9.66% YoY.
Overview
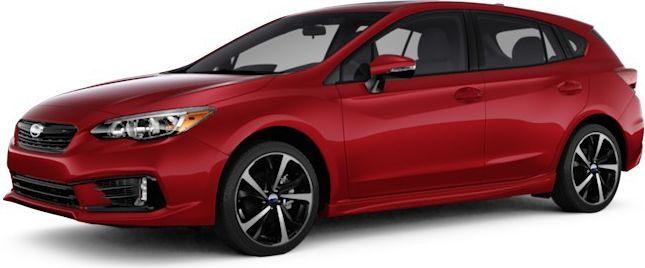
The 2024 Subaru Impreza is a vehicle from automaker Subaru.
How Much Does the 2024 Subaru Impreza Cost?
Pricing for the 2024 Subaru Impreza starts at $24,995 MSRP and goes up to $27,885 fully loaded.
Subaru Impreza Engine, Transmission, and Performance Numbers
Subaru Impreza includes a 2.0-liter engine combined with a Lineartronic Continuously Variable. This delivers 152 hp with 145 lb-ft torque delivered through a All Wheel Drive drivetrain.
List of Subaru Impreza Competitors
Some of Subaru Impreza competitors include the Subaru Legacy, Subaru CrossTrek and Honda Civic.
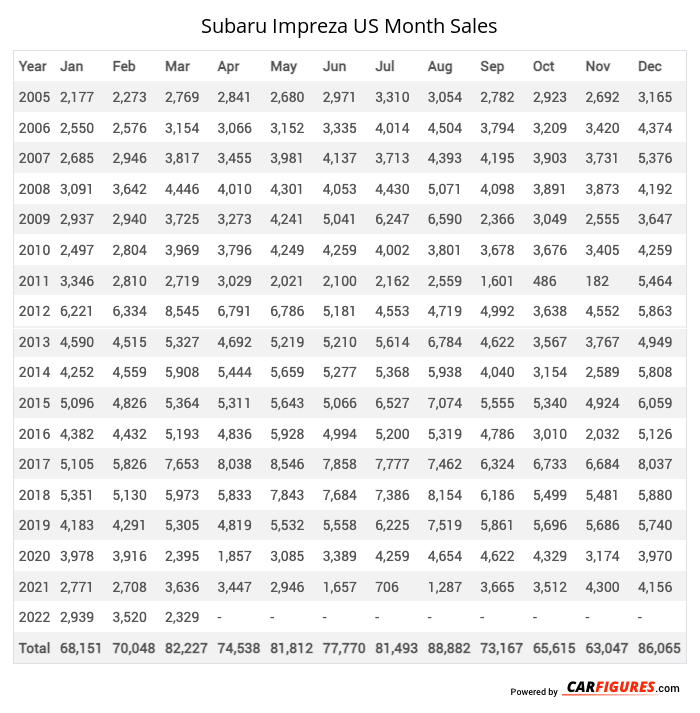
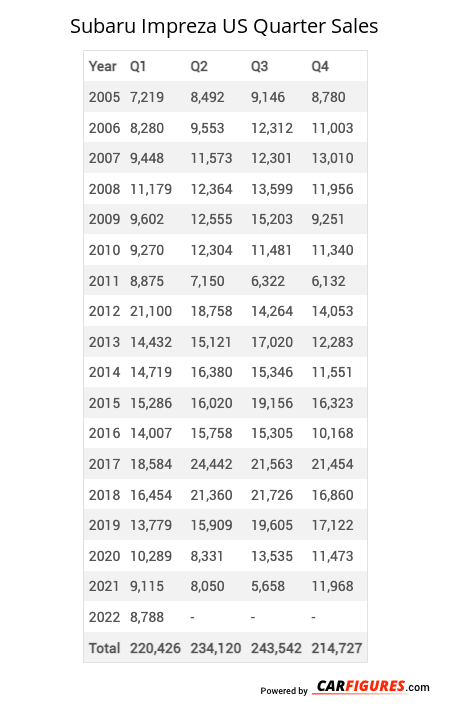
Subaru Impreza United States Sale figures by year, quarter, and month are presented below. Including the most up to date sales data for the Subaru Impreza. See how the Subaru Impreza stacks up the other models in the Cars, Compact Cars segments.
Year | Jan | Feb | Mar | Apr | May | Jun | Jul | Aug | Sep | Oct | Nov | Dec |
|---|---|---|---|---|---|---|---|---|---|---|---|---|
| 2005 | 2,177 | 2,273 | 2,769 | 2,841 | 2,680 | 2,971 | 3,310 | 3,054 | 2,782 | 2,923 | 2,692 | 3,165 |
| 2006 | 2,550 | 2,576 | 3,154 | 3,066 | 3,152 | 3,335 | 4,014 | 4,504 | 3,794 | 3,209 | 3,420 | 4,374 |
| 2007 | 2,685 | 2,946 | 3,817 | 3,455 | 3,981 | 4,137 | 3,713 | 4,393 | 4,195 | 3,903 | 3,731 | 5,376 |
| 2008 | 3,091 | 3,642 | 4,446 | 4,010 | 4,301 | 4,053 | 4,430 | 5,071 | 4,098 | 3,891 | 3,873 | 4,192 |
| 2009 | 2,937 | 2,940 | 3,725 | 3,273 | 4,241 | 5,041 | 6,247 | 6,590 | 2,366 | 3,049 | 2,555 | 3,647 |
| 2010 | 2,497 | 2,804 | 3,969 | 3,796 | 4,249 | 4,259 | 4,002 | 3,801 | 3,678 | 3,676 | 3,405 | 4,259 |
| 2011 | 3,346 | 2,810 | 2,719 | 3,029 | 2,021 | 2,100 | 2,162 | 2,559 | 1,601 | 486 | 182 | 5,464 |
| 2012 | 6,221 | 6,334 | 8,545 | 6,791 | 6,786 | 5,181 | 4,553 | 4,719 | 4,992 | 3,638 | 4,552 | 5,863 |
| 2013 | 4,590 | 4,515 | 5,327 | 4,692 | 5,219 | 5,210 | 5,614 | 6,784 | 4,622 | 3,567 | 3,767 | 4,949 |
| 2014 | 4,252 | 4,559 | 5,908 | 5,444 | 5,659 | 5,277 | 5,368 | 5,938 | 4,040 | 3,154 | 2,589 | 5,808 |
| 2015 | 5,096 | 4,826 | 5,364 | 5,311 | 5,643 | 5,066 | 6,527 | 7,074 | 5,555 | 5,340 | 4,924 | 6,059 |
| 2016 | 4,382 | 4,432 | 5,193 | 4,836 | 5,928 | 4,994 | 5,200 | 5,319 | 4,786 | 3,010 | 2,032 | 5,126 |
| 2017 | 5,105 | 5,826 | 7,653 | 8,038 | 8,546 | 7,858 | 7,777 | 7,462 | 6,324 | 6,733 | 6,684 | 8,037 |
| 2018 | 5,351 | 5,130 | 5,973 | 5,833 | 7,843 | 7,684 | 7,386 | 8,154 | 6,186 | 5,499 | 5,481 | 5,880 |
| 2019 | 4,183 | 4,291 | 5,305 | 4,819 | 5,532 | 5,558 | 6,225 | 7,519 | 5,861 | 5,696 | 5,686 | 5,740 |
| 2020 | 3,978 | 3,916 | 2,395 | 1,857 | 3,085 | 3,389 | 4,259 | 4,654 | 4,622 | 4,329 | 3,174 | 3,970 |
| 2021 | 2,771 | 2,708 | 3,636 | 3,447 | 2,946 | 1,657 | 706 | 1,287 | 3,665 | 3,512 | 4,300 | 4,156 |
| 2022 | 2,939 | 3,520 | 2,329 | 1,671 | 1,743 | 2,124 | 2,228 | 3,449 | 2,626 | 2,861 | 2,861 | 2,495 |
| 2023 | 2,451 | 2,591 | 3,802 | 3,554 | 3,939 | 2,954 | 2,800 | 2,205 | 2,868 | 2,662 | 2,370 | 2,523 |
| 2024 | 2,255 | 2,343 | 2,836 | 2,575 | 2,419 | 2,464 | 2,578 | 3,166 | 2,437 | 2,501 | 2,693 | 3,099 |
| 2025 | 2,429 | - | 3,049 | - | - | - | - | - | - | - | - | - |
| Total | 75,286 | 74,982 | 91,914 | 82,338 | 89,913 | 85,312 | 89,099 | 97,702 | 81,098 | 73,639 | 70,971 | 94,182 |
Year | Q1 | Q2 | Q3 | Q4 |
|---|---|---|---|---|
| 2005 | 7,219 | 8,492 | 9,146 | 8,780 |
| 2006 | 8,280 | 9,553 | 12,312 | 11,003 |
| 2007 | 9,448 | 11,573 | 12,301 | 13,010 |
| 2008 | 11,179 | 12,364 | 13,599 | 11,956 |
| 2009 | 9,602 | 12,555 | 15,203 | 9,251 |
| 2010 | 9,270 | 12,304 | 11,481 | 11,340 |
| 2011 | 8,875 | 7,150 | 6,322 | 6,132 |
| 2012 | 21,100 | 18,758 | 14,264 | 14,053 |
| 2013 | 14,432 | 15,121 | 17,020 | 12,283 |
| 2014 | 14,719 | 16,380 | 15,346 | 11,551 |
| 2015 | 15,286 | 16,020 | 19,156 | 16,323 |
| 2016 | 14,007 | 15,758 | 15,305 | 10,168 |
| 2017 | 18,584 | 24,442 | 21,563 | 21,454 |
| 2018 | 16,454 | 21,360 | 21,726 | 16,860 |
| 2019 | 13,779 | 15,909 | 19,605 | 17,122 |
| 2020 | 10,289 | 8,331 | 13,535 | 11,473 |
| 2021 | 9,115 | 8,050 | 5,658 | 11,968 |
| 2022 | 8,788 | 5,538 | 8,303 | 8,217 |
| 2023 | 8,844 | 10,447 | 7,873 | 7,555 |
| 2024 | 7,434 | 7,458 | 8,181 | 8,293 |
| 2025 | 5,478 | - | - | - |
| Total | 242,182 | 257,563 | 267,899 | 238,792 |
Year | Sales |
|---|---|
| 2024 | 31,366 |
| 2023 | 34,719 |
| 2022 | 30,846 |
| 2021 | 34,791 |
| 2020 | 43,628 |
| 2019 | 66,415 |
| 2018 | 76,400 |
| 2017 | 86,043 |
| 2016 | 55,238 |
| 2015 | 66,785 |
| 2014 | 57,996 |
| 2013 | 58,856 |
| 2012 | 68,175 |
| 2011 | 28,479 |
| 2010 | 44,395 |
| 2009 | 46,611 |
| 2008 | 49,098 |
| 2007 | 46,332 |
| 2006 | 41,148 |
| 2005 | 33,637 |
| Total | 1,000,958 |
Download Historic Sales Data

Embedded Code
See more widgetsSources: Manufacturers