Last updated: April 03, 2025
Key Stats
How many cars did Subaru sell in 2024?
Subaru sold 636,691 vehicles in 2024. In 2023, Subaru sold 621,829 vehicles. They sold 14,862 more vehicles in 2024 compared to 2023 with a percent gain of 2.39% YoY.
Subaru Total US Sales Statistics by Year
Subaru Total US Sales Statistics by Quarter
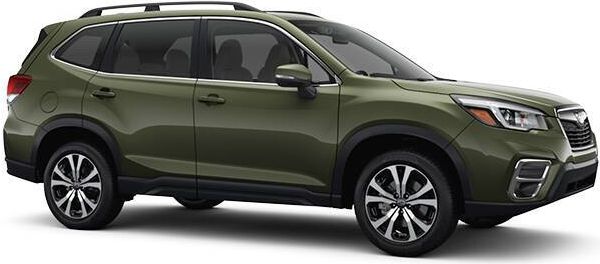
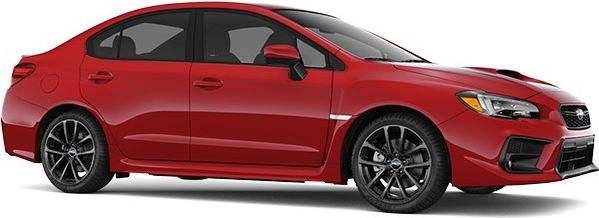
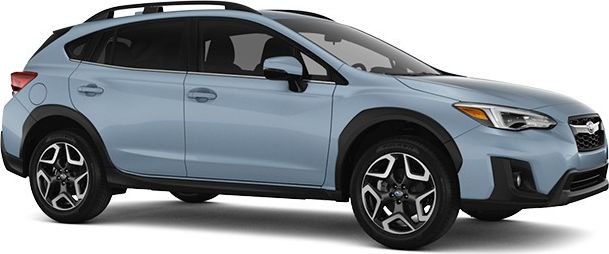
Current Lineup
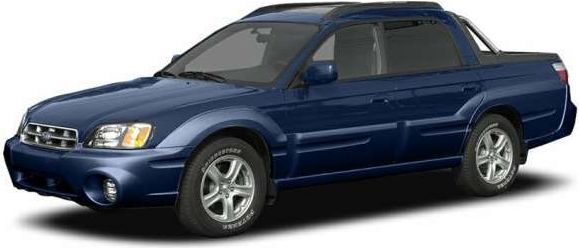
Discontinued Models
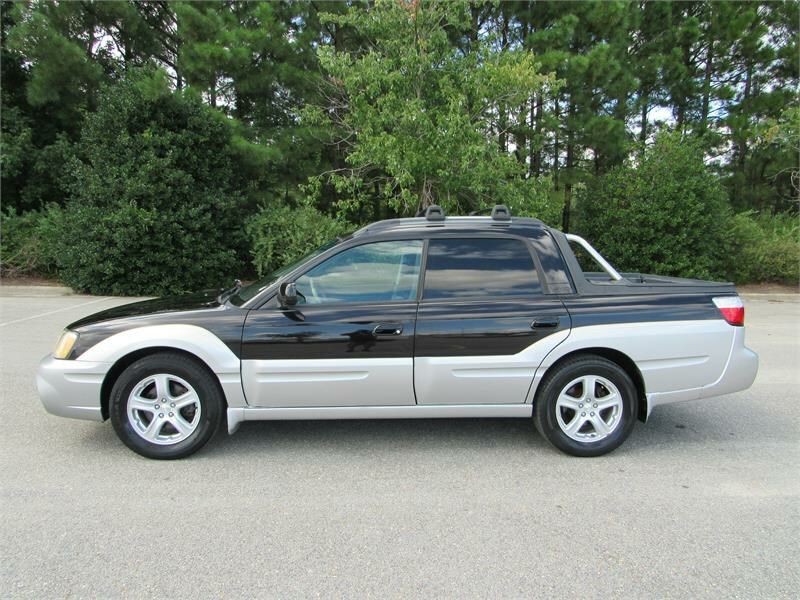
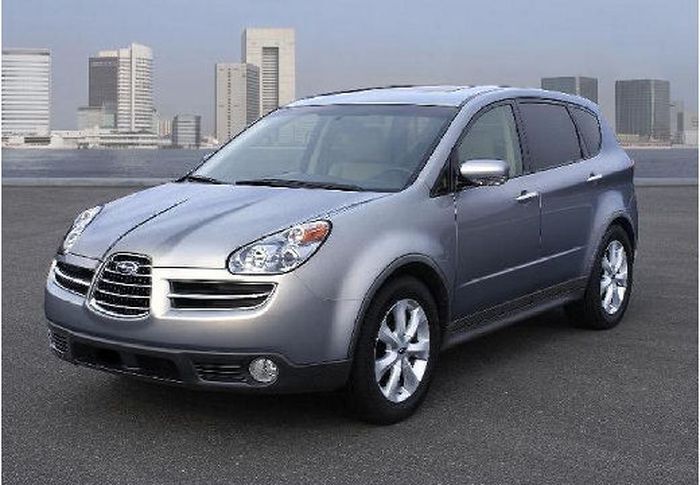
Subaru includes the cars 2024 Ascent, 2006 Baja, 2024 BRZ, 2024 CrossTrek, 2024 Forester, 2024 Impreza, 2024 Impreza WRX/STI, 2024 Legacy, 2024 Outback, 2014 Tribeca
Loading, please wait
Year | Q1 | Q2 | Q3 | Q4 |
|---|---|---|---|---|
| 2005 | 42,709 | 45,346 | 43,997 | 42,914 |
| 2006 | 39,111 | 44,533 | 46,805 | 46,399 |
| 2007 | 38,656 | 43,253 | 43,158 | 44,221 |
| 2008 | 37,891 | 49,527 | 47,303 | 42,001 |
| 2009 | 40,117 | 49,752 | 63,253 | 49,224 |
| 2010 | 56,820 | 67,829 | 67,076 | 69,623 |
| 2011 | 67,259 | 65,528 | 63,501 | 71,439 |
| 2012 | 80,568 | 83,736 | 81,159 | 91,303 |
| 2013 | 92,527 | 112,070 | 108,810 | 111,277 |
| 2014 | 112,388 | 125,368 | 137,398 | 138,160 |
| 2015 | 131,281 | 141,137 | 156,284 | 153,973 |
| 2016 | 132,397 | 147,061 | 167,429 | 168,245 |
| 2017 | 144,250 | 160,560 | 174,038 | 169,108 |
| 2018 | 149,703 | 173,157 | 180,558 | 176,717 |
| 2019 | 156,754 | 182,771 | 185,804 | 174,788 |
| 2020 | 130,591 | 136,519 | 169,446 | 175,382 |
| 2021 | 160,426 | 160,824 | 141,552 | 121,008 |
| 2022 | 132,346 | 131,449 | 137,320 | 154,547 |
| 2023 | 142,017 | 159,100 | 160,340 | 160,372 |
| 2024 | 147,445 | - | - | - |
Loading, please wait
Year | Sales |
|---|---|
| 2024 | 636,691 |
| 2023 | 621,829 |
| 2022 | 555,662 |
| 2021 | 583,810 |
| 2020 | 611,938 |
| 2019 | 700,117 |
| 2018 | 680,135 |
| 2017 | 647,956 |
| 2016 | 615,132 |
| 2015 | 582,675 |
| 2014 | 513,314 |
| 2013 | 424,684 |
| 2012 | 336,766 |
| 2011 | 267,727 |
| 2010 | 261,348 |
| 2009 | 202,346 |
| 2008 | 176,722 |
| 2007 | 169,288 |
| 2006 | 176,848 |
| 2005 | 174,966 |
| Total | 8,939,954 |