Overview
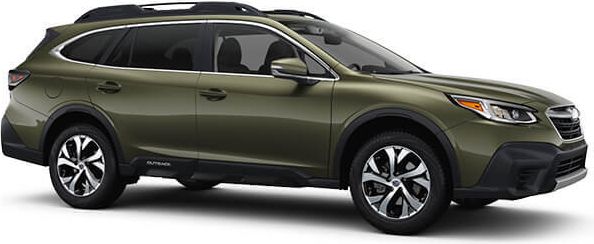
The Subaru Impreza is a Sedan with room for 5 people.
How Much Does the 2020 Subaru Impreza Cost?
The 2020 Subaru Impreza starts at $18,695 MSRP. Fully loaded, the Subaru Impreza will cost you about $26,295.
Subaru Impreza Engine, Transmission, and Performance Numbers
Subaru Impreza includes a 2.0-liter H-4 engine combined with a 5-speed manual. This delivers 152 hp with 145 lbs.-ft. Torque delivered through a drivetrain.
2020 Subaru Impreza Fuel Economy
The 2020 Subaru Impreza has a rating of 26 mpg combined. The 2020 Subaru Impreza has a fuel tank capacity of 13 gallons for a combined range of 338 miles.
2020 Subaru Impreza Specifications
The has a curb weight of 2,974 lbs. With an interior passenger volume of 99.8 cu. Ft.
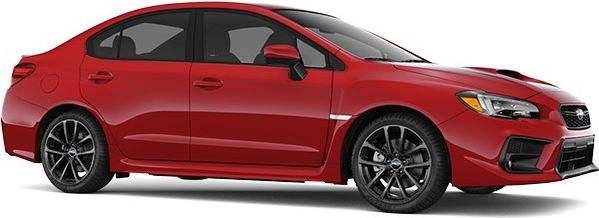
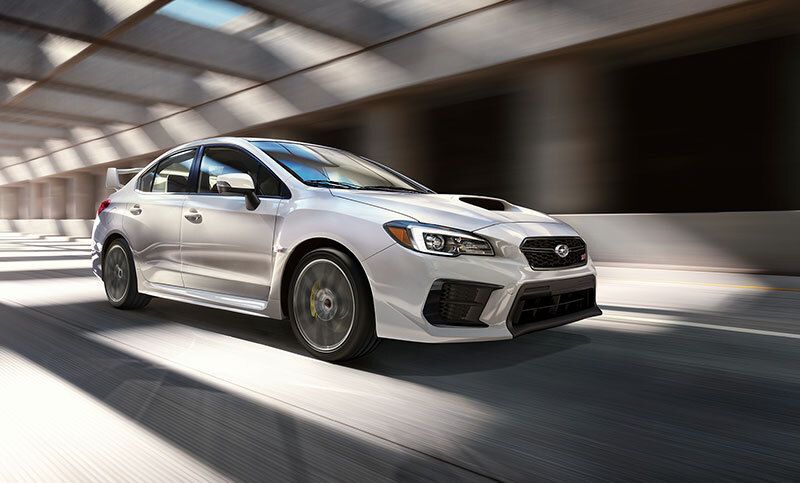
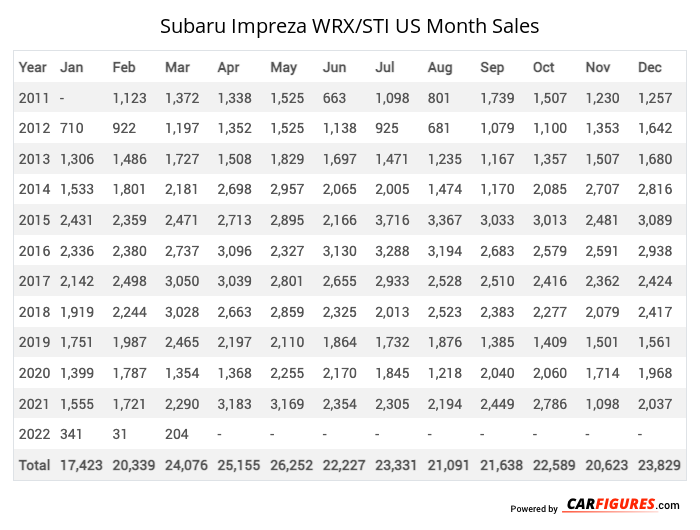
Subaru Impreza WRX/STI United States Sale figures by year, quarter, and month are presented below. Including the most up to date sales data for the Subaru Impreza WRX/STI. See how the Subaru Impreza WRX/STI stacks up the other models in the Cars, Sport/Performance Cars segments.
Year | Jan | Feb | Mar | Apr | May | Jun | Jul | Aug | Sep | Oct | Nov | Dec |
|---|---|---|---|---|---|---|---|---|---|---|---|---|
| 2011 | - | 1,123 | 1,372 | 1,338 | 1,525 | 663 | 1,098 | 801 | 1,739 | 1,507 | 1,230 | 1,257 |
| 2012 | 710 | 922 | 1,197 | 1,352 | 1,525 | 1,138 | 925 | 681 | 1,079 | 1,100 | 1,353 | 1,642 |
| 2013 | 1,306 | 1,486 | 1,727 | 1,508 | 1,829 | 1,697 | 1,471 | 1,235 | 1,167 | 1,357 | 1,507 | 1,680 |
| 2014 | 1,533 | 1,801 | 2,181 | 2,698 | 2,957 | 2,065 | 2,005 | 1,474 | 1,170 | 2,085 | 2,707 | 2,816 |
| 2015 | 2,431 | 2,359 | 2,471 | 2,713 | 2,895 | 2,166 | 3,716 | 3,367 | 3,033 | 3,013 | 2,481 | 3,089 |
| 2016 | 2,336 | 2,380 | 2,737 | 3,096 | 2,327 | 3,130 | 3,288 | 3,194 | 2,683 | 2,579 | 2,591 | 2,938 |
| 2017 | 2,142 | 2,498 | 3,050 | 3,039 | 2,801 | 2,655 | 2,933 | 2,528 | 2,510 | 2,416 | 2,362 | 2,424 |
| 2018 | 1,919 | 2,244 | 3,028 | 2,663 | 2,859 | 2,325 | 2,013 | 2,523 | 2,383 | 2,277 | 2,079 | 2,417 |
| 2019 | 1,751 | 1,987 | 2,465 | 2,197 | 2,110 | 1,864 | 1,732 | 1,876 | 1,385 | 1,409 | 1,501 | 1,561 |
| 2020 | 1,399 | 1,787 | 1,354 | 1,368 | 2,255 | 2,170 | 1,845 | 1,218 | 2,040 | 2,060 | 1,714 | 1,968 |
| 2021 | 1,555 | 1,721 | 2,290 | 3,183 | 3,169 | 2,354 | 2,305 | 2,194 | 2,449 | 2,786 | 1,098 | 2,037 |
| 2022 | 341 | 31 | 204 | 1,497 | 2,674 | 1,465 | 2,530 | 2,304 | 1,676 | 1,664 | 2,080 | 2,196 |
| 2023 | 2,006 | 2,598 | 3,005 | 2,667 | 2,771 | 2,326 | 1,894 | 1,677 | 1,630 | 1,420 | 1,305 | 0 |
| 2024 | 0 | 0 | 0 | 0 | 0 | 0 | 0 | 0 | 0 | 0 | 0 | 0 |
| 2025 | - | - | - | - | - | - | - | - | - | - | - | - |
| Total | 19,429 | 22,937 | 27,081 | 29,319 | 31,697 | 26,018 | 27,755 | 25,072 | 24,944 | 25,673 | 24,008 | 26,025 |
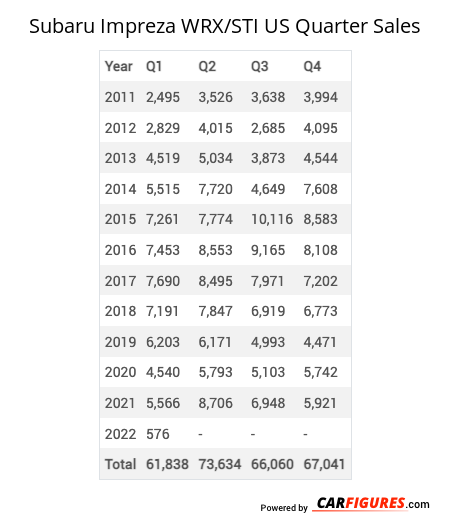
Year | Q1 | Q2 | Q3 | Q4 |
|---|---|---|---|---|
| 2011 | 2,495 | 3,526 | 3,638 | 3,994 |
| 2012 | 2,829 | 4,015 | 2,685 | 4,095 |
| 2013 | 4,519 | 5,034 | 3,873 | 4,544 |
| 2014 | 5,515 | 7,720 | 4,649 | 7,608 |
| 2015 | 7,261 | 7,774 | 10,116 | 8,583 |
| 2016 | 7,453 | 8,553 | 9,165 | 8,108 |
| 2017 | 7,690 | 8,495 | 7,971 | 7,202 |
| 2018 | 7,191 | 7,847 | 6,919 | 6,773 |
| 2019 | 6,203 | 6,171 | 4,993 | 4,471 |
| 2020 | 4,540 | 5,793 | 5,103 | 5,742 |
| 2021 | 5,566 | 8,706 | 6,948 | 5,921 |
| 2022 | 576 | 5,636 | 6,510 | 5,940 |
| 2023 | 7,609 | 7,764 | 5,201 | 2,725 |
| 2024 | 0 | 0 | 0 | 0 |
| 2025 | - | - | - | - |
| Total | 69,447 | 87,034 | 77,771 | 75,706 |
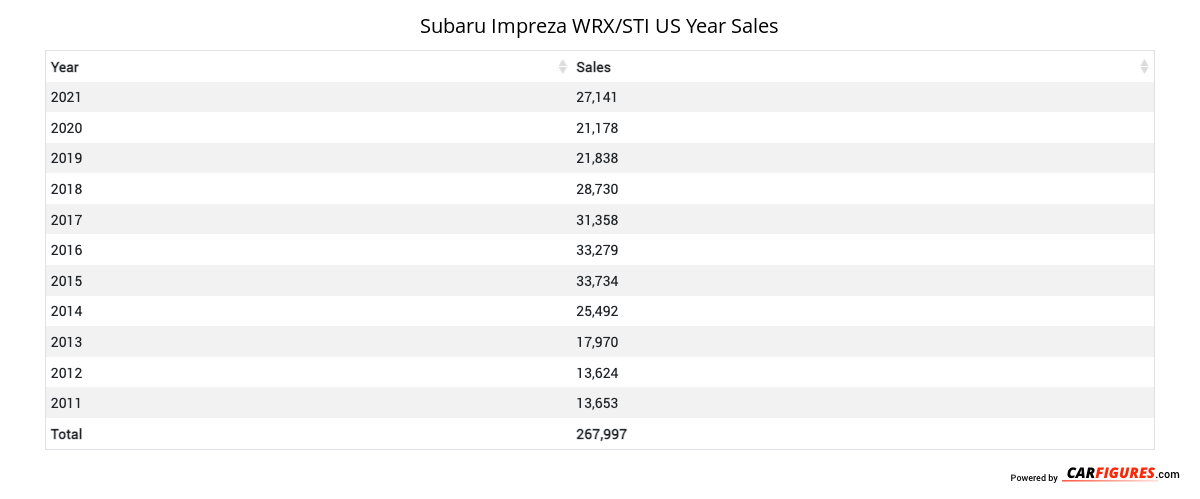
Year | Sales |
|---|---|
| 2023 | 23,299 |
| 2022 | 18,662 |
| 2021 | 27,141 |
| 2020 | 21,178 |
| 2019 | 21,838 |
| 2018 | 28,730 |
| 2017 | 31,358 |
| 2016 | 33,279 |
| 2015 | 33,734 |
| 2014 | 25,492 |
| 2013 | 17,970 |
| 2012 | 13,624 |
| 2011 | 13,653 |
| Total | 309,958 |
Download Historic Sales Data
Embedded Code
See more widgetsSources: Manufacturers