Key Stats
How many BRZ did Subaru sell in 2025?
Subaru sold 558 BRZ in 2025. (From Jan - Mar 2025)
How many BRZ did Subaru sell in March 2025?
Subaru sold 334 BRZ in March 2025.
How many BRZ did Subaru sell in 2024?
Subaru sold 3,345 BRZ in 2024. In 2023, Subaru sold 4,188 BRZ. They sold 843 more units in year 2023 compared to 2024 with a percent loss of 20.13% YoY.
Overview
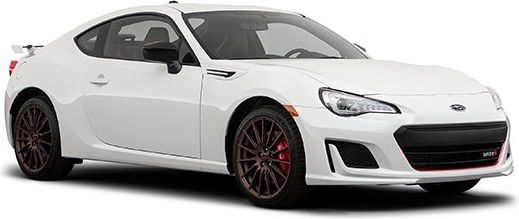
The 2022 Subaru BRZ is a vehicle from automaker Subaru.
How Much Does the 2022 Subaru BRZ Cost?
The 2022 Subaru BRZ starts at $27,995 MSRP. Fully loaded, the Subaru BRZ will cost you about $32,295.
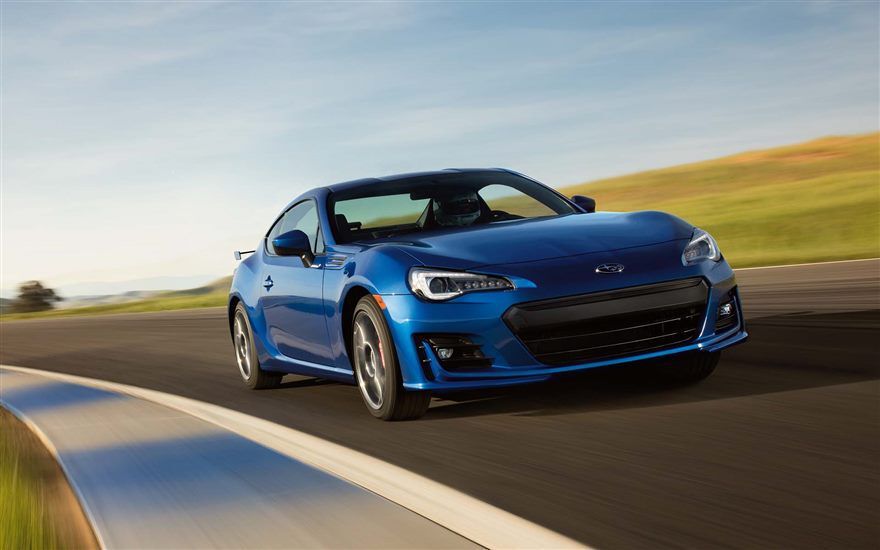
Subaru BRZ Engine, Transmission, and Performance Numbers
Subaru BRZ includes a 2.4-liter engine combined with a 6-Speed Close-Ratio Manual. This delivers 228 hp with 184 lb-ft torque delivered through a Rear Wheel Drive drivetrain.
List of Subaru BRZ Competitors
Some of Subaru BRZ competitors include the Mazda MX-5 Miata and Chevrolet Camaro.
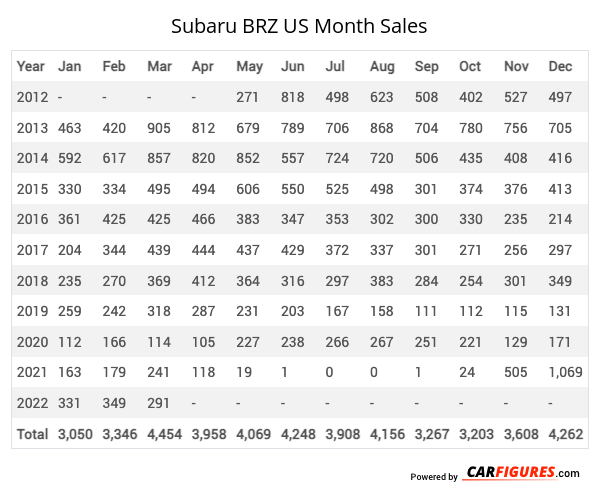
Subaru BRZ United States Sale figures by year, quarter, and month are presented below. Including the most up to date sales data for the Subaru BRZ. See how the Subaru BRZ stacks up the other models in the Cars, Sport/Performance Cars segments.
Year | Jan | Feb | Mar | Apr | May | Jun | Jul | Aug | Sep | Oct | Nov | Dec |
|---|---|---|---|---|---|---|---|---|---|---|---|---|
| 2012 | - | - | - | - | 271 | 818 | 498 | 623 | 508 | 402 | 527 | 497 |
| 2013 | 463 | 420 | 905 | 812 | 679 | 789 | 706 | 868 | 704 | 780 | 756 | 705 |
| 2014 | 592 | 617 | 857 | 820 | 852 | 557 | 724 | 720 | 506 | 435 | 408 | 416 |
| 2015 | 330 | 334 | 495 | 494 | 606 | 550 | 525 | 498 | 301 | 374 | 376 | 413 |
| 2016 | 361 | 425 | 425 | 466 | 383 | 347 | 353 | 302 | 300 | 330 | 235 | 214 |
| 2017 | 204 | 344 | 439 | 444 | 437 | 429 | 372 | 337 | 301 | 271 | 256 | 297 |
| 2018 | 235 | 270 | 369 | 412 | 364 | 316 | 297 | 383 | 284 | 254 | 301 | 349 |
| 2019 | 259 | 242 | 318 | 287 | 231 | 203 | 167 | 158 | 111 | 112 | 115 | 131 |
| 2020 | 112 | 166 | 114 | 105 | 227 | 238 | 266 | 267 | 251 | 221 | 129 | 171 |
| 2021 | 163 | 179 | 241 | 118 | 19 | 1 | 0 | 0 | 1 | 24 | 505 | 1,069 |
| 2022 | 331 | 349 | 291 | 298 | 201 | 193 | 228 | 308 | 231 | 278 | 312 | 325 |
| 2023 | 332 | 368 | 285 | 507 | 638 | 382 | 311 | 268 | 270 | 291 | 263 | 273 |
| 2024 | 250 | 243 | 273 | 178 | 227 | 243 | 271 | 347 | 291 | 365 | 320 | 337 |
| 2025 | 224 | - | 334 | - | - | - | - | - | - | - | - | - |
| Total | 3,856 | 3,957 | 5,346 | 4,941 | 5,135 | 5,066 | 4,718 | 5,079 | 4,059 | 4,137 | 4,503 | 5,197 |
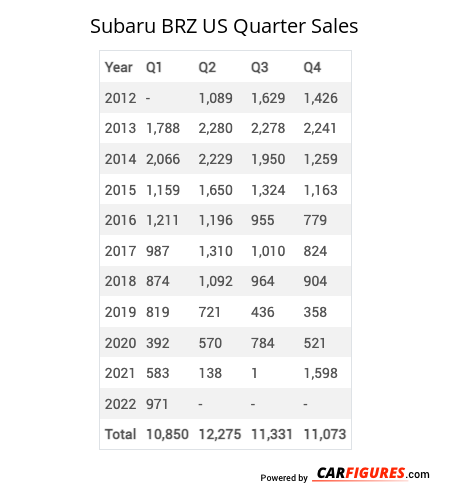
Year | Q1 | Q2 | Q3 | Q4 |
|---|---|---|---|---|
| 2012 | - | 1,089 | 1,629 | 1,426 |
| 2013 | 1,788 | 2,280 | 2,278 | 2,241 |
| 2014 | 2,066 | 2,229 | 1,950 | 1,259 |
| 2015 | 1,159 | 1,650 | 1,324 | 1,163 |
| 2016 | 1,211 | 1,196 | 955 | 779 |
| 2017 | 987 | 1,310 | 1,010 | 824 |
| 2018 | 874 | 1,092 | 964 | 904 |
| 2019 | 819 | 721 | 436 | 358 |
| 2020 | 392 | 570 | 784 | 521 |
| 2021 | 583 | 138 | 1 | 1,598 |
| 2022 | 971 | 692 | 767 | 915 |
| 2023 | 985 | 1,527 | 849 | 827 |
| 2024 | 766 | 648 | 909 | 1,022 |
| 2025 | 558 | - | - | - |
| Total | 13,159 | 15,142 | 13,856 | 13,837 |
Year | Sales |
|---|---|
| 2024 | 3,345 |
| 2023 | 4,188 |
| 2022 | 3,345 |
| 2021 | 2,320 |
| 2020 | 2,267 |
| 2019 | 2,334 |
| 2018 | 3,834 |
| 2017 | 4,131 |
| 2016 | 4,141 |
| 2015 | 5,296 |
| 2014 | 7,504 |
| 2013 | 8,587 |
| 2012 | 4,144 |
| Total | 55,436 |
Download Historic Sales Data

Embedded Code
See more widgetsSources: Manufacturers