Overview
The Mercedes-Benz AMG SLC 43 is a Convertible with room for 2 people.
How Much Does the 2020 Mercedes-Benz AMG SLC 43 Cost?
The 2020 Mercedes-Benz AMG SLC 43 starts at $64,650 MSRP. Fully loaded, the Mercedes-Benz AMG SLC 43 will cost you about $64,650.
Mercedes-Benz AMG SLC 43 Engine, Transmission, and Performance Numbers
Mercedes-Benz AMG SLC 43 includes a 3.0-liter V-6 engine combined with a. This delivers 385 hp with torque delivered through a RWD drivetrain.
2020 Mercedes-Benz AMG SLC 43 Fuel Economy
The 2020 Mercedes-Benz AMG SLC 43 has a rating of 23 mpg combined.
List of Mercedes-Benz AMG SLC 43 Competitors
Some of Mercedes-Benz AMG SLC 43 competitors include the BMW 8-Series, Jaguar F-Type and Porsche 911.
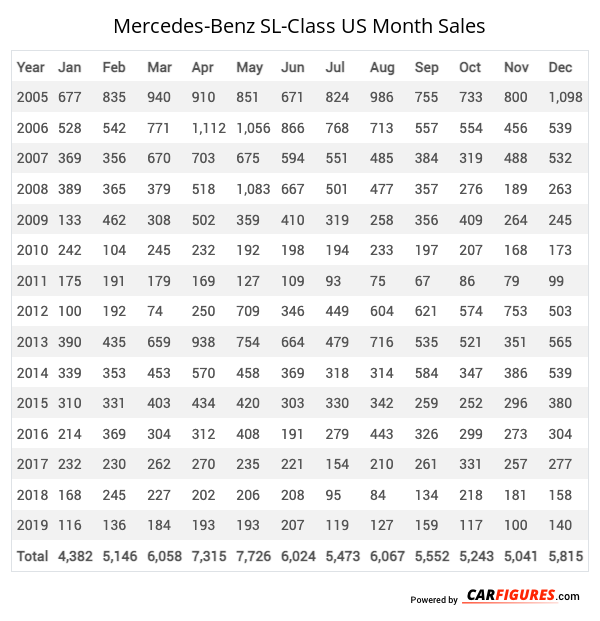
Mercedes-Benz SL-Class United States Sale figures by year, quarter, and month are presented below. Including the most up to date sales data for the Mercedes-Benz SL-Class. See how the Mercedes-Benz SL-Class stacks up the other models in the Cars, Premium Sport/Performance Cars segments.
Year | Jan | Feb | Mar | Apr | May | Jun | Jul | Aug | Sep | Oct | Nov | Dec |
|---|---|---|---|---|---|---|---|---|---|---|---|---|
| 2005 | 677 | 835 | 940 | 910 | 851 | 671 | 824 | 986 | 755 | 733 | 800 | 1,098 |
| 2006 | 528 | 542 | 771 | 1,112 | 1,056 | 866 | 768 | 713 | 557 | 554 | 456 | 539 |
| 2007 | 369 | 356 | 670 | 703 | 675 | 594 | 551 | 485 | 384 | 319 | 488 | 532 |
| 2008 | 389 | 365 | 379 | 518 | 1,083 | 667 | 501 | 477 | 357 | 276 | 189 | 263 |
| 2009 | 133 | 462 | 308 | 502 | 359 | 410 | 319 | 258 | 356 | 409 | 264 | 245 |
| 2010 | 242 | 104 | 245 | 232 | 192 | 198 | 194 | 233 | 197 | 207 | 168 | 173 |
| 2011 | 175 | 191 | 179 | 169 | 127 | 109 | 93 | 75 | 67 | 86 | 79 | 99 |
| 2012 | 100 | 192 | 74 | 250 | 709 | 346 | 449 | 604 | 621 | 574 | 753 | 503 |
| 2013 | 390 | 435 | 659 | 938 | 754 | 664 | 479 | 716 | 535 | 521 | 351 | 565 |
| 2014 | 339 | 353 | 453 | 570 | 458 | 369 | 318 | 314 | 584 | 347 | 386 | 539 |
| 2015 | 310 | 331 | 403 | 434 | 420 | 303 | 330 | 342 | 259 | 252 | 296 | 380 |
| 2016 | 214 | 369 | 304 | 312 | 408 | 191 | 279 | 443 | 326 | 299 | 273 | 304 |
| 2017 | 232 | 230 | 262 | 270 | 235 | 221 | 154 | 210 | 261 | 331 | 257 | 277 |
| 2018 | 168 | 245 | 227 | 202 | 206 | 208 | 95 | 84 | 134 | 218 | 181 | 158 |
| 2019 | 116 | 136 | 184 | 193 | 193 | 207 | 119 | 127 | 159 | 117 | 100 | 140 |
| Total | 4,382 | 5,146 | 6,058 | 7,315 | 7,726 | 6,024 | 5,473 | 6,067 | 5,552 | 5,243 | 5,041 | 5,815 |
Year | Q1 | Q2 | Q3 | Q4 |
|---|---|---|---|---|
| 2005 | 2,452 | 2,432 | 2,565 | 2,631 |
| 2006 | 1,841 | 3,034 | 2,038 | 1,549 |
| 2007 | 1,395 | 1,972 | 1,420 | 1,339 |
| 2008 | 1,133 | 2,268 | 1,335 | 728 |
| 2009 | 903 | 1,271 | 933 | 918 |
| 2010 | 591 | 622 | 624 | 548 |
| 2011 | 545 | 405 | 235 | 264 |
| 2012 | 366 | 1,305 | 1,674 | 1,830 |
| 2013 | 1,484 | 2,356 | 1,730 | 1,437 |
| 2014 | 1,145 | 1,397 | 1,216 | 1,272 |
| 2015 | 1,044 | 1,157 | 931 | 928 |
| 2016 | 887 | 911 | 1,048 | 876 |
| 2017 | 724 | 726 | 625 | 865 |
| 2018 | 640 | 616 | 313 | 557 |
| 2019 | 436 | 593 | 405 | 357 |
| 2020 | 401 | 394 | 555 | 432 |
| 2021 | 311 | 133 | 14 | 4 |
| 2022 | 3 | 0 | 0 | 0 |
| 2023 | 0 | 0 | 0 | 0 |
| 2024 | 0 | 0 | 0 | 0 |
| 2025 | - | - | - | - |
| Total | 16,301 | 21,592 | 17,661 | 16,535 |
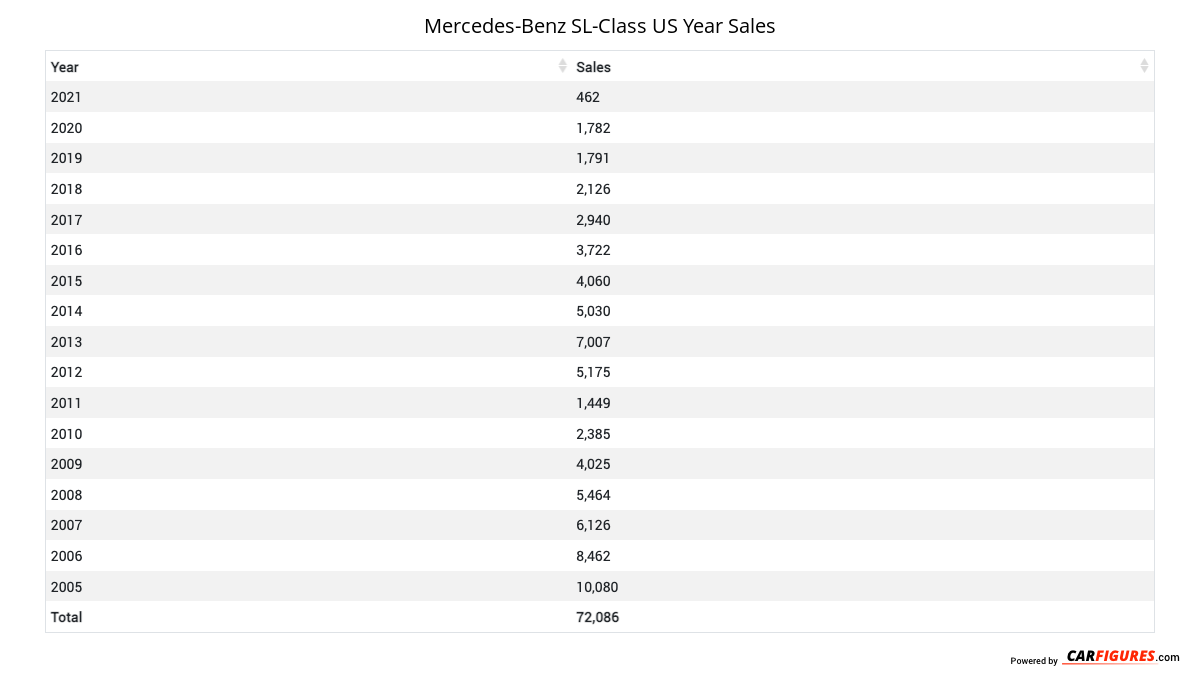
Year | Sales |
|---|---|
| 2022 | 3 |
| 2021 | 462 |
| 2020 | 1,782 |
| 2019 | 1,791 |
| 2018 | 2,126 |
| 2017 | 2,940 |
| 2016 | 3,722 |
| 2015 | 4,060 |
| 2014 | 5,030 |
| 2013 | 7,007 |
| 2012 | 5,175 |
| 2011 | 1,449 |
| 2010 | 2,385 |
| 2009 | 4,025 |
| 2008 | 5,464 |
| 2007 | 6,126 |
| 2006 | 8,462 |
| 2005 | 10,080 |
| Total | 72,089 |
Download Historic Sales Data

Embedded Code
See more widgetsSources: Manufacturers


