Overview
The 2022 Mercedes-Benz GLC 300 is a vehicle from automaker Mercedes-Benz.
How Much Does the 2022 Mercedes-Benz GLC 300 Cost?
The 2022 Mercedes-Benz GLC 300 starts at $43,850 MSRP. Fully loaded, the Mercedes-Benz GLC 300 will cost you about $52,500.
Mercedes-Benz GLC 300 Engine, Transmission, and Performance Numbers
Mercedes-Benz GLC 300 is powered by a 2.0-liter engine with a Rear Wheel Drive powertrain that makes 255 -hp and 273 lb-ft torque. The transmission on the Mercedes-Benz GLC 300 is an 9G-TRONIC 9-Speed Automatic.
List of Mercedes-Benz GLC 300 Competitors
Some of Mercedes-Benz GLC 300 competitors include the BMW X3, Audi Q5 and Jaguar F-Pace.
Mercedes-Benz GLC-Class United States Sale figures by year, quarter, and month are presented below. Including the most up to date sales data for the Mercedes-Benz GLC-Class. See how the Mercedes-Benz GLC-Class stacks up the other models in the Crossover/SUVS, Premium Compact Crossover/SUVs segments.
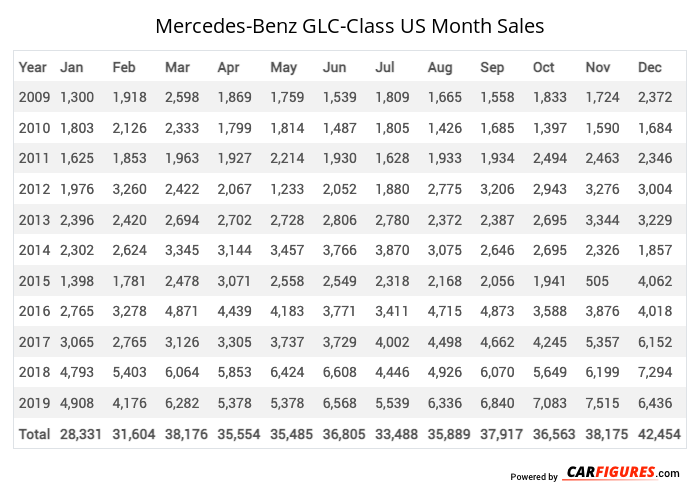
Year | Jan | Feb | Mar | Apr | May | Jun | Jul | Aug | Sep | Oct | Nov | Dec |
|---|---|---|---|---|---|---|---|---|---|---|---|---|
| 2009 | 1,300 | 1,918 | 2,598 | 1,869 | 1,759 | 1,539 | 1,809 | 1,665 | 1,558 | 1,833 | 1,724 | 2,372 |
| 2010 | 1,803 | 2,126 | 2,333 | 1,799 | 1,814 | 1,487 | 1,805 | 1,426 | 1,685 | 1,397 | 1,590 | 1,684 |
| 2011 | 1,625 | 1,853 | 1,963 | 1,927 | 2,214 | 1,930 | 1,628 | 1,933 | 1,934 | 2,494 | 2,463 | 2,346 |
| 2012 | 1,976 | 3,260 | 2,422 | 2,067 | 1,233 | 2,052 | 1,880 | 2,775 | 3,206 | 2,943 | 3,276 | 3,004 |
| 2013 | 2,396 | 2,420 | 2,694 | 2,702 | 2,728 | 2,806 | 2,780 | 2,372 | 2,387 | 2,695 | 3,344 | 3,229 |
| 2014 | 2,302 | 2,624 | 3,345 | 3,144 | 3,457 | 3,766 | 3,870 | 3,075 | 2,646 | 2,695 | 2,326 | 1,857 |
| 2015 | 1,398 | 1,781 | 2,478 | 3,071 | 2,558 | 2,549 | 2,318 | 2,168 | 2,056 | 1,941 | 505 | 4,062 |
| 2016 | 2,765 | 3,278 | 4,871 | 4,439 | 4,183 | 3,771 | 3,411 | 4,715 | 4,873 | 3,588 | 3,876 | 4,018 |
| 2017 | 3,065 | 2,765 | 3,126 | 3,305 | 3,737 | 3,729 | 4,002 | 4,498 | 4,662 | 4,245 | 5,357 | 6,152 |
| 2018 | 4,793 | 5,403 | 6,064 | 5,853 | 6,424 | 6,608 | 4,446 | 4,926 | 6,070 | 5,649 | 6,199 | 7,294 |
| 2019 | 4,908 | 4,176 | 6,282 | 5,378 | 5,378 | 6,568 | 5,539 | 6,336 | 6,840 | 7,083 | 7,515 | 6,436 |
| Total | 28,331 | 31,604 | 38,176 | 35,554 | 35,485 | 36,805 | 33,488 | 35,889 | 37,917 | 36,563 | 38,175 | 42,454 |
Year | Q1 | Q2 | Q3 | Q4 |
|---|---|---|---|---|
| 2009 | 5,816 | 5,167 | 5,032 | 5,929 |
| 2010 | 6,262 | 5,100 | 4,916 | 4,671 |
| 2011 | 5,441 | 6,071 | 5,495 | 7,303 |
| 2012 | 7,658 | 5,352 | 7,861 | 9,223 |
| 2013 | 7,510 | 8,236 | 7,539 | 9,268 |
| 2014 | 8,271 | 10,367 | 9,591 | 6,878 |
| 2015 | 5,657 | 8,178 | 6,542 | 6,508 |
| 2016 | 10,914 | 12,393 | 12,999 | 11,482 |
| 2017 | 8,956 | 10,771 | 13,162 | 15,754 |
| 2018 | 16,260 | 18,885 | 15,442 | 19,142 |
| 2019 | 15,366 | 17,324 | 18,715 | 21,034 |
| 2020 | 13,098 | 9,461 | 11,428 | 18,639 |
| 2021 | 15,569 | 14,580 | 7,982 | 13,674 |
| 2022 | 16,910 | 19,149 | 0 | 0 |
| 2023 | 0 | 0 | 0 | 0 |
| 2024 | 0 | 0 | 0 | 0 |
| 2025 | - | - | - | - |
| Total | 143,688 | 151,034 | 126,704 | 149,505 |
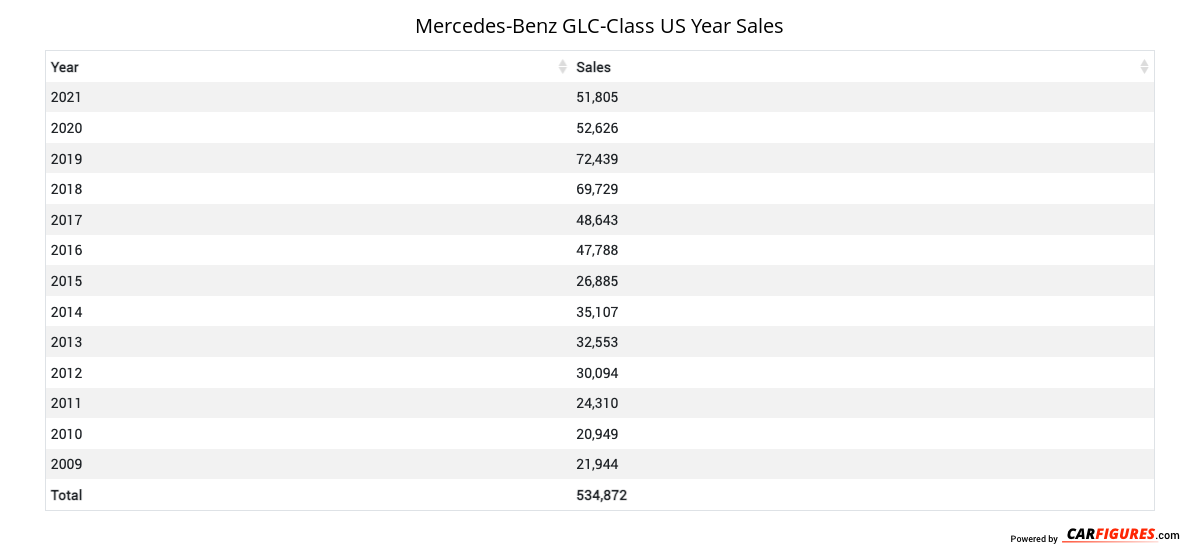
Year | Sales |
|---|---|
| 2022 | 36,059 |
| 2021 | 51,805 |
| 2020 | 52,626 |
| 2019 | 72,439 |
| 2018 | 69,729 |
| 2017 | 48,643 |
| 2016 | 47,788 |
| 2015 | 26,885 |
| 2014 | 35,107 |
| 2013 | 32,553 |
| 2012 | 30,094 |
| 2011 | 24,310 |
| 2010 | 20,949 |
| 2009 | 21,944 |
| Total | 570,931 |
Download Historic Sales Data

Embedded Code
See more widgetsSources: Manufacturers