Last updated: April 03, 2025
Key Stats
How many cars did Lexus sell in 2024?
Lexus sold 307,328 vehicles in 2024. In 2023, Lexus sold 306,662 vehicles. They sold 666 more vehicles in 2024 compared to 2023 with a percent gain of 0.22% YoY.
Lexus Total US Sales Statistics by Year
Lexus Total US Sales Statistics by Quarter
Current Lineup
Discontinued Models
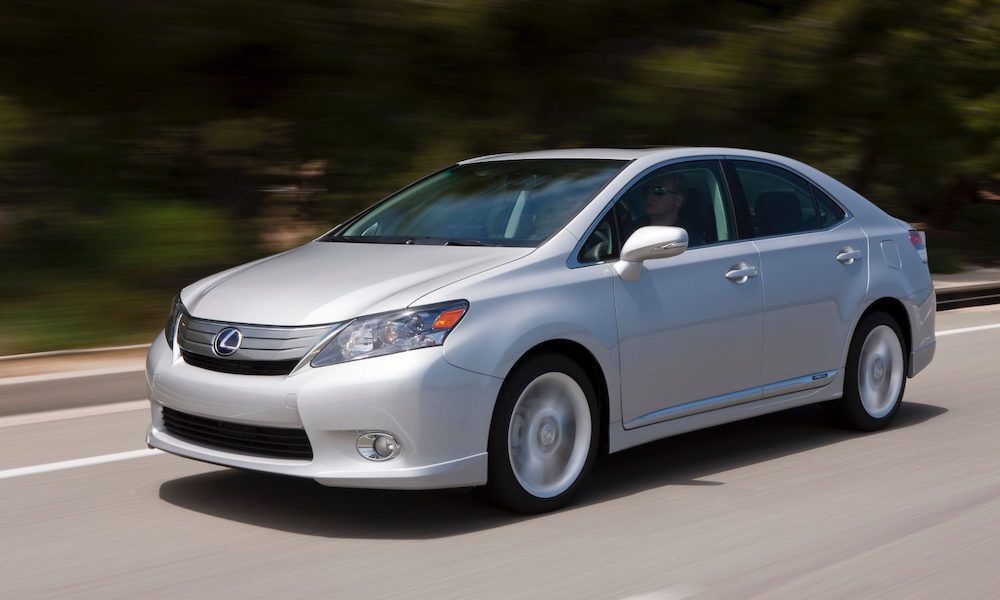

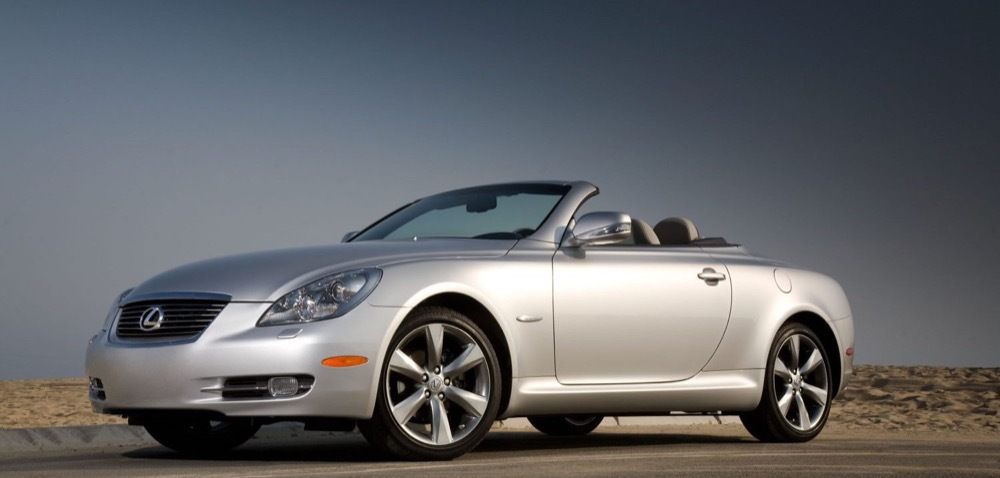
Lexus includes the cars 2017 CT, 2024 ES, 2024 GS, 2024 GX, 2012 HS, 2024 IS, 2024 LC, 2012 LFA, 2024 LS, 2024 LX, 2024 NX, 2024 RC, 2024 RX, 2010 SC, 2024 UX
Loading, please wait
Year | Q1 | Q2 | Q3 | Q4 |
|---|---|---|---|---|
| 2005 | 63,444 | 78,562 | 76,723 | 84,166 |
| 2006 | 69,212 | 83,673 | 84,615 | 88,659 |
| 2007 | 74,044 | 87,227 | 84,830 | 85,282 |
| 2008 | 66,946 | 70,196 | 68,508 | 55,868 |
| 2009 | 42,069 | 47,991 | 59,348 | 66,567 |
| 2010 | 49,523 | 57,907 | 55,008 | 66,891 |
| 2011 | 47,356 | 40,654 | 47,637 | 62,905 |
| 2012 | 49,096 | 59,036 | 62,858 | 73,176 |
| 2013 | 56,740 | 61,675 | 72,345 | 83,087 |
| 2014 | 65,085 | 73,604 | 81,994 | 90,706 |
| 2015 | 77,180 | 81,668 | 88,597 | 97,156 |
| 2016 | 74,221 | 77,343 | 84,629 | 95,035 |
| 2017 | 61,845 | 71,912 | 85,899 | 85,473 |
| 2018 | 64,211 | 70,783 | 78,622 | 84,686 |
| 2019 | 66,791 | 68,944 | 73,816 | 88,561 |
| 2020 | 56,345 | 48,987 | 75,285 | 92,954 |
| 2021 | 74,253 | 83,459 | 81,093 | 65,670 |
| 2022 | 64,365 | 66,723 | 67,524 | 59,822 |
| 2023 | 68,069 | 80,227 | 73,502 | 84,864 |
| 2024 | 66,912 | - | - | - |
Loading, please wait
Year | Sales |
|---|---|
| 2024 | 307,328 |
| 2023 | 306,662 |
| 2022 | 258,434 |
| 2021 | 304,475 |
| 2020 | 273,571 |
| 2019 | 298,112 |
| 2018 | 298,302 |
| 2017 | 305,129 |
| 2016 | 331,228 |
| 2015 | 344,601 |
| 2014 | 311,389 |
| 2013 | 273,847 |
| 2012 | 244,166 |
| 2011 | 198,552 |
| 2010 | 229,329 |
| 2009 | 215,975 |
| 2008 | 261,518 |
| 2007 | 331,383 |
| 2006 | 326,159 |
| 2005 | 302,895 |
| Total | 5,723,055 |