
Key Stats
How many UX did Lexus sell in 2025?
Lexus sold 2,525 UX in 2025. (From Jan - Mar 2025)
How many UX did Lexus sell in March 2025?
Lexus sold 988 UX in March 2025.
How many UX did Lexus sell in 2024?
Lexus sold 8,877 UX in 2024. In 2023, Lexus sold 11,846 UX. They sold 2,969 more units in year 2023 compared to 2024 with a percent loss of 25.06% YoY.
Overview
The 2022 Lexus UX 200 is a vehicle from automaker Lexus.
How Much Does the 2022 Lexus UX 200 Cost?
The 2022 Lexus UX 200 starts at $33,150 MSRP. Fully loaded, the Lexus UX 200 will cost you about $38,190.
Lexus UX 200 Engine, Transmission, and Performance Numbers
Lexus UX 200 includes a 2.0-liter engine combined with a 10-Speed Direct Shift CVT. This delivers 169 hp with 151 lb-ft torque delivered through a Front Wheel Drive drivetrain.
List of Lexus UX 200 Competitors
Some of Lexus UX 200 competitors include the Mercedes-Benz GLA-Class, BMW X1 and Audi Q3.
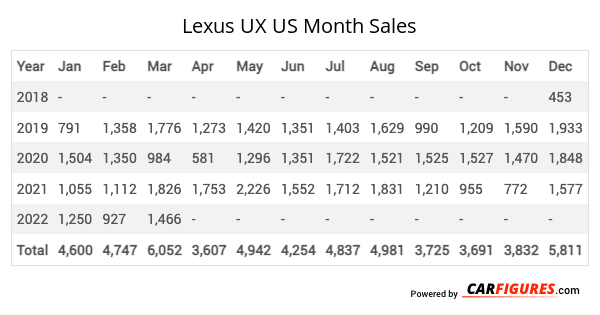
Lexus UX United States Sale figures by year, quarter, and month are presented below. Including the most up to date sales data for the Lexus UX. See how the Lexus UX stacks up the other models in the Crossover/SUVS, Premium Subcompact Crossover/SUVs segments.
Year | Jan | Feb | Mar | Apr | May | Jun | Jul | Aug | Sep | Oct | Nov | Dec |
|---|---|---|---|---|---|---|---|---|---|---|---|---|
| 2018 | - | - | - | - | - | - | - | - | - | - | - | 453 |
| 2019 | 791 | 1,358 | 1,776 | 1,273 | 1,420 | 1,351 | 1,403 | 1,629 | 990 | 1,209 | 1,590 | 1,933 |
| 2020 | 1,504 | 1,350 | 984 | 581 | 1,296 | 1,351 | 1,722 | 1,521 | 1,525 | 1,527 | 1,470 | 1,848 |
| 2021 | 1,055 | 1,112 | 1,826 | 1,753 | 2,226 | 1,552 | 1,712 | 1,831 | 1,210 | 955 | 772 | 1,577 |
| 2022 | 1,250 | 927 | 1,466 | 907 | 836 | 543 | 605 | 712 | 604 | 624 | 703 | 1,060 |
| 2023 | 868 | 1,074 | 1,250 | 1,426 | 1,172 | 1,012 | 898 | 848 | 826 | 851 | 738 | 883 |
| 2024 | 730 | 793 | 1,178 | 1,009 | 944 | 718 | 581 | 526 | 402 | 416 | 632 | 948 |
| 2025 | 753 | 784 | 988 | - | - | - | - | - | - | - | - | - |
| Total | 6,951 | 7,398 | 9,468 | 6,949 | 7,894 | 6,527 | 6,921 | 7,067 | 5,557 | 5,582 | 5,905 | 8,702 |
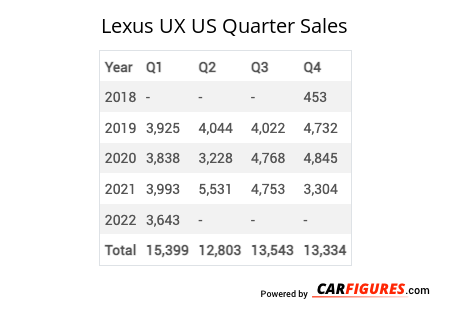
Year | Q1 | Q2 | Q3 | Q4 |
|---|---|---|---|---|
| 2018 | - | - | - | 453 |
| 2019 | 3,925 | 4,044 | 4,022 | 4,732 |
| 2020 | 3,838 | 3,228 | 4,768 | 4,845 |
| 2021 | 3,993 | 5,531 | 4,753 | 3,304 |
| 2022 | 3,643 | 2,286 | 1,921 | 2,387 |
| 2023 | 3,192 | 3,610 | 2,572 | 2,472 |
| 2024 | 2,701 | 2,671 | 1,509 | 1,996 |
| 2025 | 2,525 | - | - | - |
| Total | 23,817 | 21,370 | 19,545 | 20,189 |
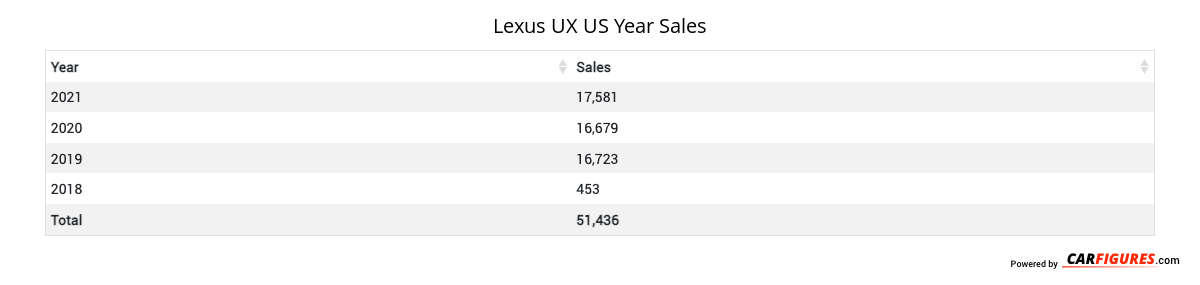
Year | Sales |
|---|---|
| 2024 | 8,877 |
| 2023 | 11,846 |
| 2022 | 10,237 |
| 2021 | 17,581 |
| 2020 | 16,679 |
| 2019 | 16,723 |
| 2018 | 453 |
| Total | 82,396 |
Download Historic Sales Data
Embedded Code
See more widgetsSources: Manufacturers