Key Stats
How many LS did Lexus sell in 2025?
Lexus sold 280 LS in 2025. (From Jan - Feb 2025)
How many LS did Lexus sell in February 2025?
Lexus sold 137 LS in February 2025.
How many LS did Lexus sell in 2024?
Lexus sold 2,163 LS in 2024. In 2023, Lexus sold 2,237 LS. They sold 74 more units in year 2023 compared to 2024 with a percent loss of 3.31% YoY.
Overview
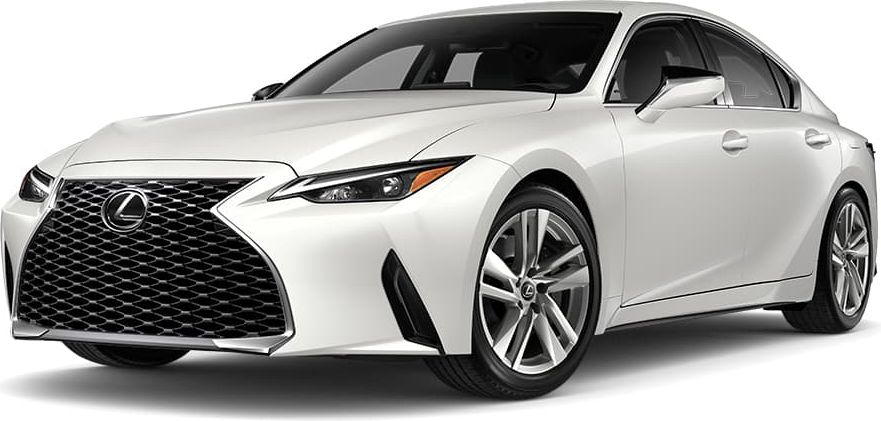
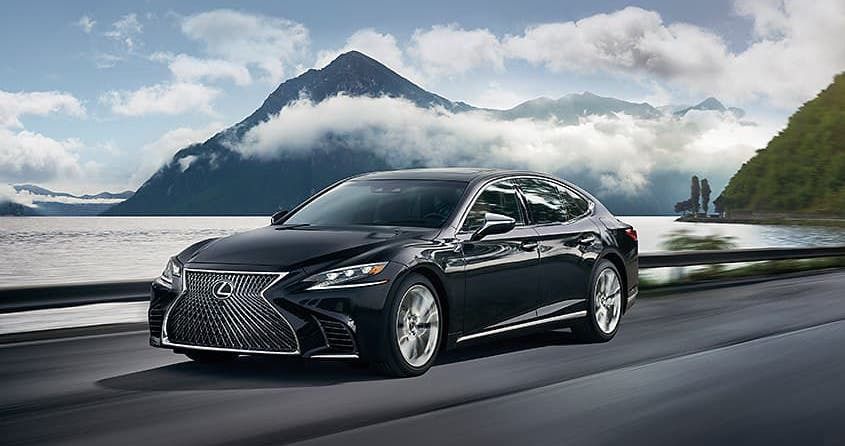
The 2022 Lexus LS 500 is a vehicle from automaker Lexus.
How Much Does the 2022 Lexus LS 500 Cost?
The 2022 Lexus LS 500 starts at $76,000 MSRP. Fully loaded, the Lexus LS 500 will cost you about $79,600.
Lexus LS 500 Engine, Transmission, and Performance Numbers
Lexus LS 500 includes a 3.5-liter engine combined with a 10-Speed Automatic. This delivers 416 hp with 442 lb-ft torque delivered through a Rear Wheel Drive drivetrain.
List of Lexus LS 500 Competitors
Some of Lexus LS 500 competitors include the Mercedes-Benz S-Class, Audi A8 and Genesis G90.
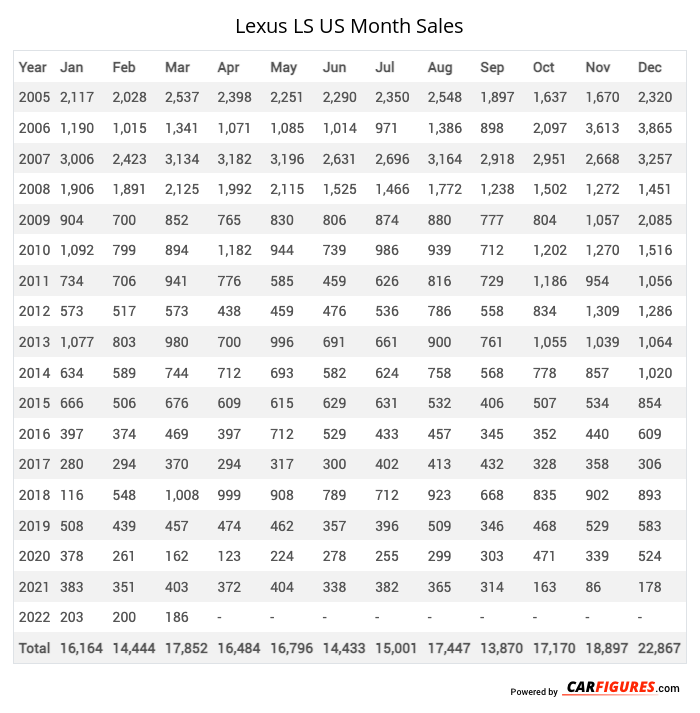
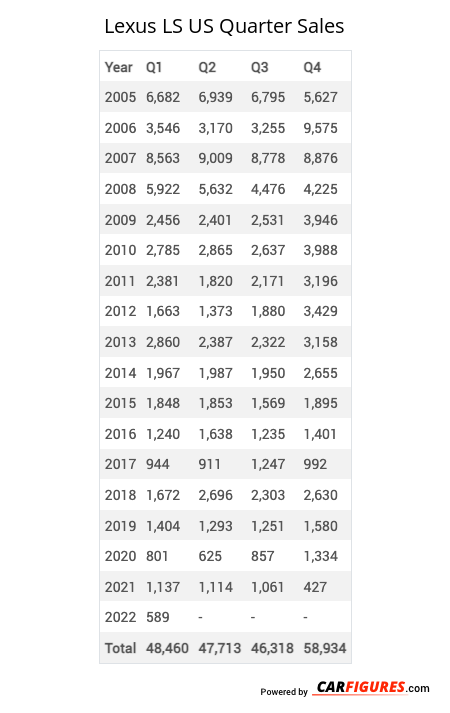
Lexus LS United States Sale figures by year, quarter, and month are presented below. Including the most up to date sales data for the Lexus LS. See how the Lexus LS stacks up the other models in the Cars, Premium Large Cars segments.
Year | Jan | Feb | Mar | Apr | May | Jun | Jul | Aug | Sep | Oct | Nov | Dec |
|---|---|---|---|---|---|---|---|---|---|---|---|---|
| 2005 | 2,117 | 2,028 | 2,537 | 2,398 | 2,251 | 2,290 | 2,350 | 2,548 | 1,897 | 1,637 | 1,670 | 2,320 |
| 2006 | 1,190 | 1,015 | 1,341 | 1,071 | 1,085 | 1,014 | 971 | 1,386 | 898 | 2,097 | 3,613 | 3,865 |
| 2007 | 3,006 | 2,423 | 3,134 | 3,182 | 3,196 | 2,631 | 2,696 | 3,164 | 2,918 | 2,951 | 2,668 | 3,257 |
| 2008 | 1,906 | 1,891 | 2,125 | 1,992 | 2,115 | 1,525 | 1,466 | 1,772 | 1,238 | 1,502 | 1,272 | 1,451 |
| 2009 | 904 | 700 | 852 | 765 | 830 | 806 | 874 | 880 | 777 | 804 | 1,057 | 2,085 |
| 2010 | 1,092 | 799 | 894 | 1,182 | 944 | 739 | 986 | 939 | 712 | 1,202 | 1,270 | 1,516 |
| 2011 | 734 | 706 | 941 | 776 | 585 | 459 | 626 | 816 | 729 | 1,186 | 954 | 1,056 |
| 2012 | 573 | 517 | 573 | 438 | 459 | 476 | 536 | 786 | 558 | 834 | 1,309 | 1,286 |
| 2013 | 1,077 | 803 | 980 | 700 | 996 | 691 | 661 | 900 | 761 | 1,055 | 1,039 | 1,064 |
| 2014 | 634 | 589 | 744 | 712 | 693 | 582 | 624 | 758 | 568 | 778 | 857 | 1,020 |
| 2015 | 666 | 506 | 676 | 609 | 615 | 629 | 631 | 532 | 406 | 507 | 534 | 854 |
| 2016 | 397 | 374 | 469 | 397 | 712 | 529 | 433 | 457 | 345 | 352 | 440 | 609 |
| 2017 | 280 | 294 | 370 | 294 | 317 | 300 | 402 | 413 | 432 | 328 | 358 | 306 |
| 2018 | 116 | 548 | 1,008 | 999 | 908 | 789 | 712 | 923 | 668 | 835 | 902 | 893 |
| 2019 | 508 | 439 | 457 | 474 | 462 | 357 | 396 | 509 | 346 | 468 | 529 | 583 |
| 2020 | 378 | 261 | 162 | 123 | 224 | 278 | 255 | 299 | 303 | 471 | 339 | 524 |
| 2021 | 383 | 351 | 403 | 372 | 404 | 338 | 382 | 365 | 314 | 163 | 86 | 178 |
| 2022 | 203 | 200 | 186 | 228 | 157 | 274 | 243 | 231 | 267 | 234 | 233 | 223 |
| 2023 | 179 | 166 | 234 | 220 | 241 | 174 | 181 | 180 | 153 | 169 | 159 | 181 |
| 2024 | 212 | 224 | 247 | 200 | 187 | 144 | 156 | 186 | 150 | 140 | 159 | 158 |
| 2025 | 143 | 137 | - | - | - | - | - | - | - | - | - | - |
| Total | 16,698 | 14,971 | 18,333 | 17,132 | 17,381 | 15,025 | 15,581 | 18,044 | 14,440 | 17,713 | 19,448 | 23,429 |
Year | Q1 | Q2 | Q3 | Q4 |
|---|---|---|---|---|
| 2005 | 6,682 | 6,939 | 6,795 | 5,627 |
| 2006 | 3,546 | 3,170 | 3,255 | 9,575 |
| 2007 | 8,563 | 9,009 | 8,778 | 8,876 |
| 2008 | 5,922 | 5,632 | 4,476 | 4,225 |
| 2009 | 2,456 | 2,401 | 2,531 | 3,946 |
| 2010 | 2,785 | 2,865 | 2,637 | 3,988 |
| 2011 | 2,381 | 1,820 | 2,171 | 3,196 |
| 2012 | 1,663 | 1,373 | 1,880 | 3,429 |
| 2013 | 2,860 | 2,387 | 2,322 | 3,158 |
| 2014 | 1,967 | 1,987 | 1,950 | 2,655 |
| 2015 | 1,848 | 1,853 | 1,569 | 1,895 |
| 2016 | 1,240 | 1,638 | 1,235 | 1,401 |
| 2017 | 944 | 911 | 1,247 | 992 |
| 2018 | 1,672 | 2,696 | 2,303 | 2,630 |
| 2019 | 1,404 | 1,293 | 1,251 | 1,580 |
| 2020 | 801 | 625 | 857 | 1,334 |
| 2021 | 1,137 | 1,114 | 1,061 | 427 |
| 2022 | 589 | 659 | 741 | 690 |
| 2023 | 579 | 635 | 514 | 509 |
| 2024 | 683 | 531 | 492 | 457 |
| Total | 49,722 | 49,538 | 48,065 | 60,590 |
Year | Sales |
|---|---|
| 2024 | 2,163 |
| 2023 | 2,237 |
| 2022 | 2,679 |
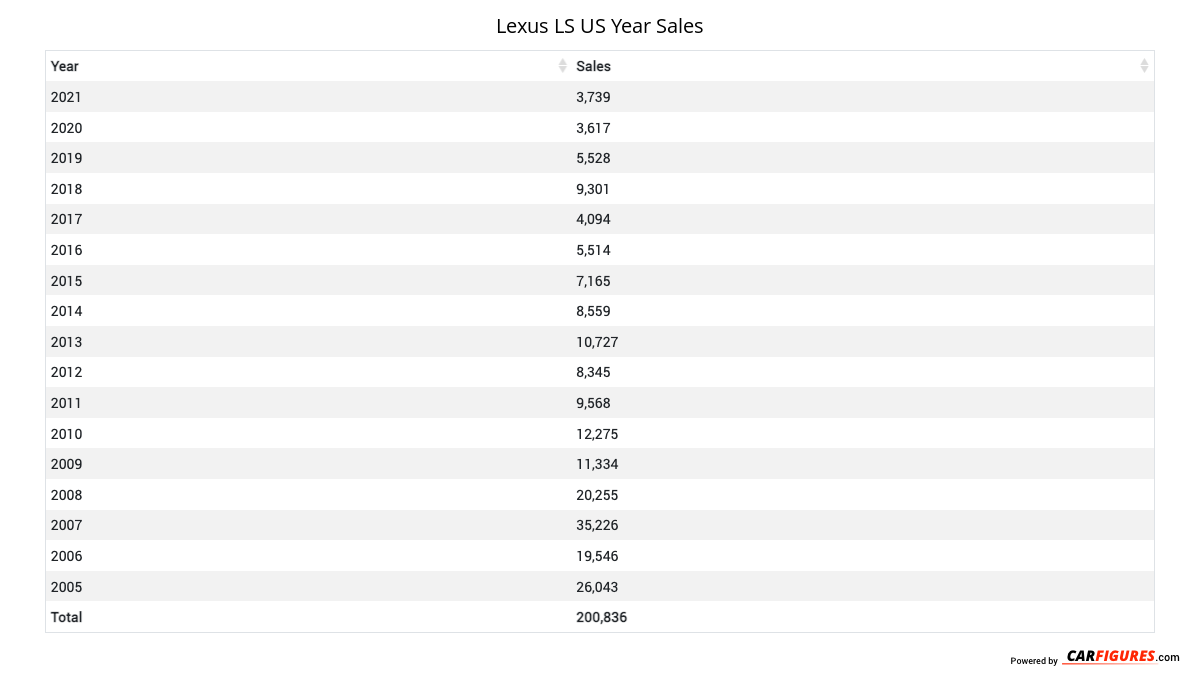
| 2021 | 3,739 |
| 2020 | 3,617 |
| 2019 | 5,528 |
| 2018 | 9,301 |
| 2017 | 4,094 |
| 2016 | 5,514 |
| 2015 | 7,165 |
| 2014 | 8,559 |
| 2013 | 10,727 |
| 2012 | 8,345 |
| 2011 | 9,568 |
| 2010 | 12,275 |
| 2009 | 11,334 |
| 2008 | 20,255 |
| 2007 | 35,226 |
| 2006 | 19,546 |
| 2005 | 26,043 |
| Total | 207,915 |
Download Historic Sales Data
Embedded Code
See more widgetsSources: Manufacturers