
Key Stats
How many LC did Lexus sell in 2025?
Lexus sold 519 LC in 2025. (From Jan - Mar 2025)
How many LC did Lexus sell in March 2025?
Lexus sold 149 LC in March 2025.
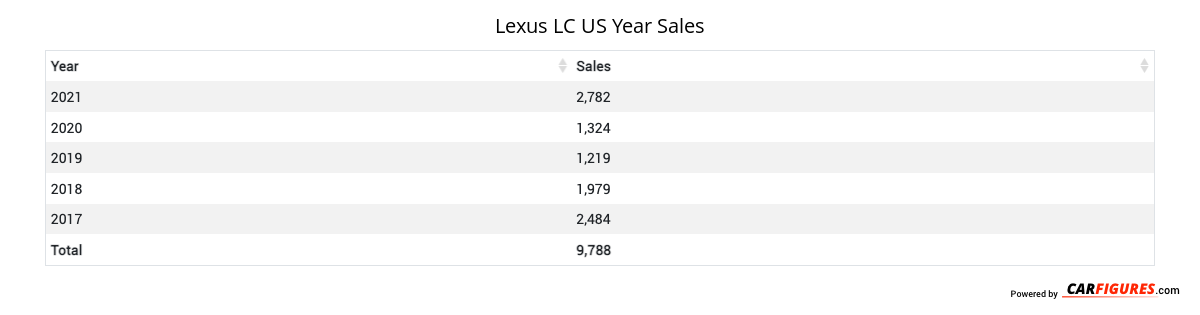
How many LC did Lexus sell in 2024?
Lexus sold 1,464 LC in 2024. In 2023, Lexus sold 1,761 LC. They sold 297 more units in year 2023 compared to 2024 with a percent loss of 16.87% YoY.
Overview
The 2024 Lexus LC 500 is a vehicle from automaker Lexus.
How Much Does the 2024 Lexus LC 500 Cost?
The 2024 Lexus LC 500 starts at $105,200 MSRP. Fully loaded, the Lexus LC 500 will cost you about $97,700.
Lexus LC 500 Engine, Transmission, and Performance Numbers
Lexus LC 500 includes a 5.0-liter engine combined with a 10-Speed Sport Direct Shift Automatic. This delivers 471 hp with 398 lb-ft torque delivered through a Rear Wheel Drive drivetrain.
List of Lexus LC 500 Competitors
Some of Lexus LC 500 competitors include the Chevrolet Corvette, Porsche 911 and BMW 8-Series.
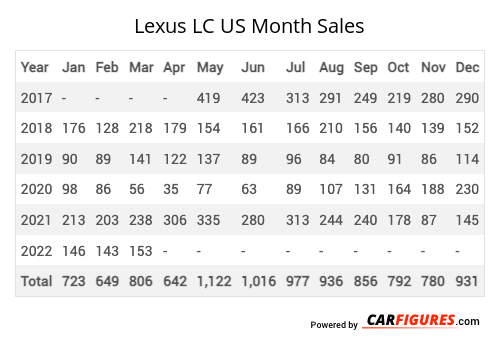
Lexus LC United States Sale figures by year, quarter, and month are presented below. Including the most up to date sales data for the Lexus LC. See how the Lexus LC stacks up the other models in the Cars, Premium Sport/Performance Cars segments.
Year | Jan | Feb | Mar | Apr | May | Jun | Jul | Aug | Sep | Oct | Nov | Dec |
|---|---|---|---|---|---|---|---|---|---|---|---|---|
| 2017 | - | - | - | - | 419 | 423 | 313 | 291 | 249 | 219 | 280 | 290 |
| 2018 | 176 | 128 | 218 | 179 | 154 | 161 | 166 | 210 | 156 | 140 | 139 | 152 |
| 2019 | 90 | 89 | 141 | 122 | 137 | 89 | 96 | 84 | 80 | 91 | 86 | 114 |
| 2020 | 98 | 86 | 56 | 35 | 77 | 63 | 89 | 107 | 131 | 164 | 188 | 230 |
| 2021 | 213 | 203 | 238 | 306 | 335 | 280 | 313 | 244 | 240 | 178 | 87 | 145 |
| 2022 | 146 | 143 | 153 | 147 | 141 | 103 | 61 | 28 | 71 | 102 | 114 | 178 |
| 2023 | 114 | 152 | 167 | 132 | 128 | 132 | 162 | 166 | 178 | 149 | 127 | 154 |
| 2024 | 149 | 141 | 203 | 178 | 160 | 135 | 105 | 121 | 102 | 68 | 30 | 72 |
| 2025 | 185 | 185 | 149 | - | - | - | - | - | - | - | - | - |
| Total | 1,171 | 1,127 | 1,325 | 1,099 | 1,551 | 1,386 | 1,305 | 1,251 | 1,207 | 1,111 | 1,051 | 1,335 |
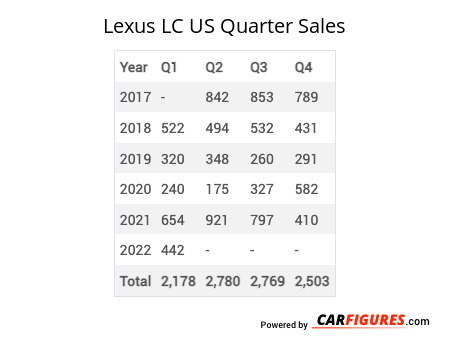
Year | Q1 | Q2 | Q3 | Q4 |
|---|---|---|---|---|
| 2017 | - | 842 | 853 | 789 |
| 2018 | 522 | 494 | 532 | 431 |
| 2019 | 320 | 348 | 260 | 291 |
| 2020 | 240 | 175 | 327 | 582 |
| 2021 | 654 | 921 | 797 | 410 |
| 2022 | 442 | 391 | 160 | 394 |
| 2023 | 433 | 392 | 506 | 430 |
| 2024 | 493 | 473 | 328 | 170 |
| 2025 | 519 | - | - | - |
| Total | 3,623 | 4,036 | 3,763 | 3,497 |
Year | Sales |
|---|---|
| 2024 | 1,464 |
| 2023 | 1,761 |
| 2022 | 1,387 |
| 2021 | 2,782 |
| 2020 | 1,324 |
| 2019 | 1,219 |
| 2018 | 1,979 |
| 2017 | 2,484 |
| Total | 14,400 |
Download Historic Sales Data
Embedded Code
See more widgetsSources: Manufacturers