Key Stats
How many NX did Lexus sell in 2025?
Lexus sold 17,992 NX in 2025. (From Jan - Mar 2025)
How many NX did Lexus sell in March 2025?
Lexus sold 7,077 NX in March 2025.
How many NX did Lexus sell in 2024?
Lexus sold 74,488 NX in 2024. In 2023, Lexus sold 74,526 NX. They sold 38 more units in year 2023 compared to 2024 with a percent loss of 0.05% YoY.
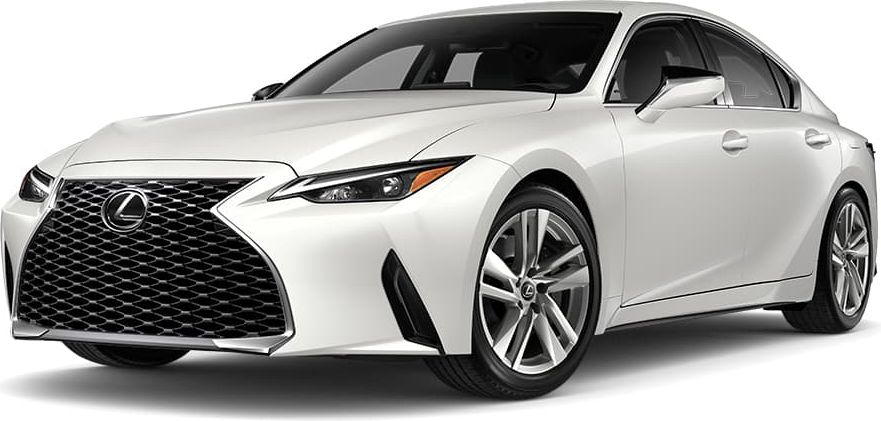
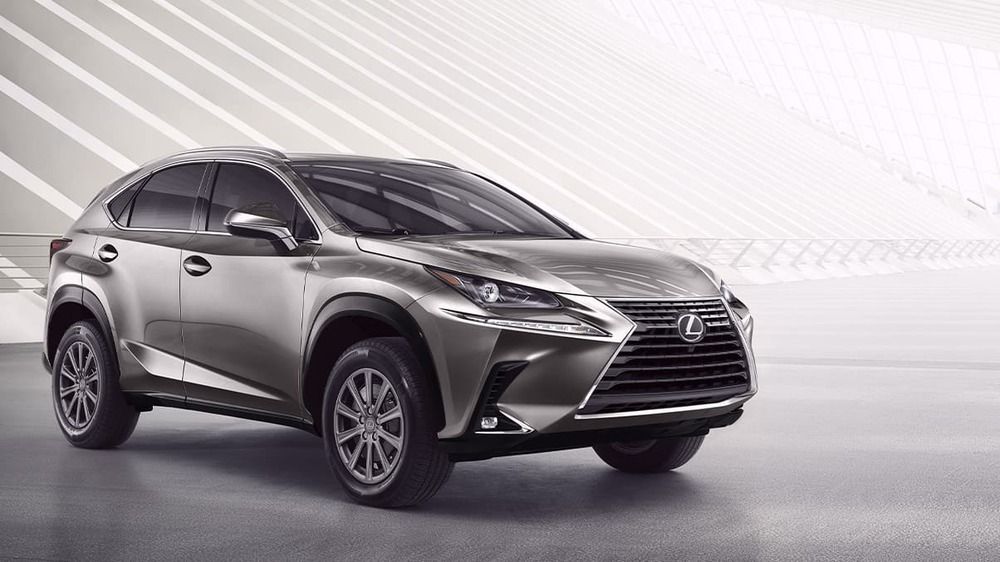
Overview
The Lexus NX 300 is a SUV with room for 5 people.
How Much Does the 2020 Lexus NX 300 Cost?
The 2020 Lexus NX 300 starts at $36,870 MSRP. Fully loaded, the Lexus NX 300 will cost you about $45,360.
Lexus NX 300 Engine, Transmission, and Performance Numbers
Lexus NX 300 is powered by a 2.0-liter I-4 engine with a FWD powertrain that makes 235 -hp and torque. The transmission on the Lexus NX 300 is an.
2020 Lexus NX 300 Fuel Economy
The 2020 Lexus NX 300 has a rating of 24 mpg combined.
List of Lexus NX 300 Competitors
Some of Lexus NX 300 competitors include the Mercedes-Benz GLB-Class, Acura RDX and Infiniti QX50.
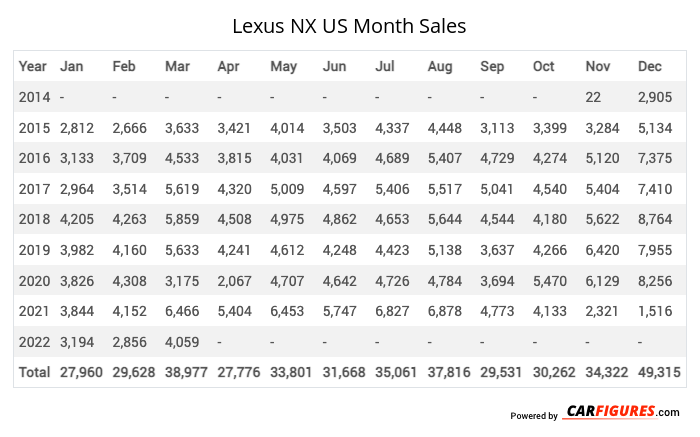
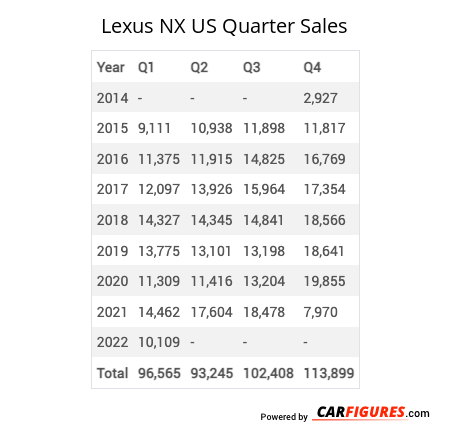
Lexus NX United States Sale figures by year, quarter, and month are presented below. Including the most up to date sales data for the Lexus NX. See how the Lexus NX stacks up the other models in the Crossover/SUVS, Premium Compact Crossover/SUVs segments.
Year | Jan | Feb | Mar | Apr | May | Jun | Jul | Aug | Sep | Oct | Nov | Dec |
|---|---|---|---|---|---|---|---|---|---|---|---|---|
| 2014 | - | - | - | - | - | - | - | - | - | - | 22 | 2,905 |
| 2015 | 2,812 | 2,666 | 3,633 | 3,421 | 4,014 | 3,503 | 4,337 | 4,448 | 3,113 | 3,399 | 3,284 | 5,134 |
| 2016 | 3,133 | 3,709 | 4,533 | 3,815 | 4,031 | 4,069 | 4,689 | 5,407 | 4,729 | 4,274 | 5,120 | 7,375 |
| 2017 | 2,964 | 3,514 | 5,619 | 4,320 | 5,009 | 4,597 | 5,406 | 5,517 | 5,041 | 4,540 | 5,404 | 7,410 |
| 2018 | 4,205 | 4,263 | 5,859 | 4,508 | 4,975 | 4,862 | 4,653 | 5,644 | 4,544 | 4,180 | 5,622 | 8,764 |
| 2019 | 3,982 | 4,160 | 5,633 | 4,241 | 4,612 | 4,248 | 4,423 | 5,138 | 3,637 | 4,266 | 6,420 | 7,955 |
| 2020 | 3,826 | 4,308 | 3,175 | 2,067 | 4,707 | 4,642 | 4,726 | 4,784 | 3,694 | 5,470 | 6,129 | 8,256 |
| 2021 | 3,844 | 4,152 | 6,466 | 5,404 | 6,453 | 5,747 | 6,827 | 6,878 | 4,773 | 4,133 | 2,321 | 1,516 |
| 2022 | 3,194 | 2,856 | 4,059 | 2,750 | 3,019 | 3,737 | 4,433 | 3,883 | 3,720 | 5,557 | 5,706 | 6,088 |
| 2023 | 5,093 | 4,662 | 5,801 | 5,320 | 6,237 | 6,925 | 5,951 | 5,565 | 6,131 | 6,930 | 7,332 | 8,579 |
| 2024 | 5,079 | 5,316 | 6,724 | 5,296 | 5,440 | 6,784 | 6,604 | 7,238 | 5,034 | 5,788 | 7,065 | 8,120 |
| 2025 | 5,573 | 5,342 | 7,077 | - | - | - | - | - | - | - | - | - |
| Total | 43,705 | 44,948 | 58,579 | 41,142 | 48,497 | 49,114 | 52,049 | 54,502 | 44,416 | 48,537 | 54,425 | 72,102 |
Year | Q1 | Q2 | Q3 | Q4 |
|---|---|---|---|---|
| 2014 | - | - | - | 2,927 |
| 2015 | 9,111 | 10,938 | 11,898 | 11,817 |
| 2016 | 11,375 | 11,915 | 14,825 | 16,769 |
| 2017 | 12,097 | 13,926 | 15,964 | 17,354 |
| 2018 | 14,327 | 14,345 | 14,841 | 18,566 |
| 2019 | 13,775 | 13,101 | 13,198 | 18,641 |
| 2020 | 11,309 | 11,416 | 13,204 | 19,855 |
| 2021 | 14,462 | 17,604 | 18,478 | 7,970 |
| 2022 | 10,109 | 9,506 | 12,036 | 17,351 |
| 2023 | 15,556 | 18,482 | 17,647 | 22,841 |
| 2024 | 17,119 | 17,520 | 18,876 | 20,973 |
| 2025 | 17,992 | - | - | - |
| Total | 147,232 | 138,753 | 150,967 | 175,064 |
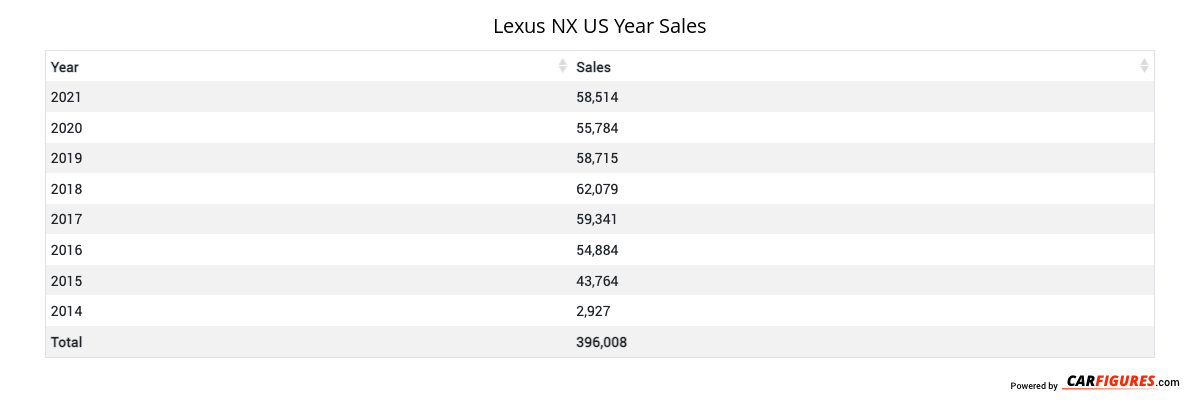
Year | Sales |
|---|---|
| 2024 | 74,488 |
| 2023 | 74,526 |
| 2022 | 49,002 |
| 2021 | 58,514 |
| 2020 | 55,784 |
| 2019 | 58,715 |
| 2018 | 62,079 |
| 2017 | 59,341 |
| 2016 | 54,884 |
| 2015 | 43,764 |
| 2014 | 2,927 |
| Total | 594,024 |
Download Historic Sales Data
Embedded Code
See more widgetsSources: Manufacturers