

Overview
The 2024 Land Rover Discovery Sport is a vehicle from automaker Land Rover.
How Much Does the 2024 Land Rover Discovery Sport Cost?
Pricing for the 2024 Land Rover Discovery Sport starts at $48,900 MSRP and goes up to $53,100 fully loaded.
Land Rover Discovery Sport Engine, Transmission, and Performance Numbers
Land Rover Discovery Sport is powered by a 2.0-liter engine with a Four Wheel Drive powertrain that makes 246 -hp and 269 lb-ft torque. The transmission on the Land Rover Discovery Sport is an 9-Speed ZF9HP50 Automatic.
List of Land Rover Discovery Sport Competitors
Some of Land Rover Discovery Sport competitors include the Mercedes-Benz GLC-Class and BMW X5.
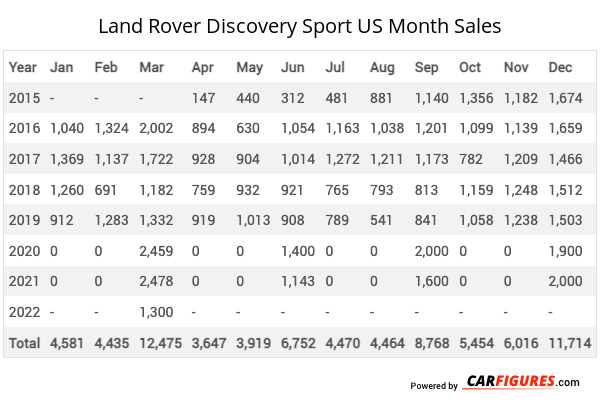
Land Rover Discovery Sport United States Sale figures by year, quarter, and month are presented below. Including the most up to date sales data for the Land Rover Discovery Sport. See how the Land Rover Discovery Sport stacks up the other models in the Crossover/SUVS, Premium Compact Crossover/SUVs segments.
Year | Jan | Feb | Mar | Apr | May | Jun | Jul | Aug | Sep | Oct | Nov | Dec |
|---|---|---|---|---|---|---|---|---|---|---|---|---|
| 2015 | - | - | - | 147 | 440 | 312 | 481 | 881 | 1,140 | 1,356 | 1,182 | 1,674 |
| 2016 | 1,040 | 1,324 | 2,002 | 894 | 630 | 1,054 | 1,163 | 1,038 | 1,201 | 1,099 | 1,139 | 1,659 |
| 2017 | 1,369 | 1,137 | 1,722 | 928 | 904 | 1,014 | 1,272 | 1,211 | 1,173 | 782 | 1,209 | 1,466 |
| 2018 | 1,260 | 691 | 1,182 | 759 | 932 | 921 | 765 | 793 | 813 | 1,159 | 1,248 | 1,512 |
| 2019 | 912 | 1,283 | 1,332 | 919 | 1,013 | 908 | 789 | 541 | 841 | 1,058 | 1,238 | 1,503 |
| 2020 | 0 | 0 | 2,459 | 0 | 0 | 1,400 | 0 | 0 | 2,000 | 0 | 0 | 1,900 |
| 2021 | 0 | 0 | 2,478 | 0 | 0 | 1,143 | 0 | 0 | 1,600 | 0 | 0 | 2,000 |
| 2022 | 0 | 0 | 1,300 | 0 | 0 | 1,212 | 0 | 0 | 0 | 0 | 0 | 0 |
| 2023 | 0 | 0 | 1,418 | 0 | 0 | 0 | 0 | 0 | 0 | 0 | 0 | 0 |
| 2024 | 0 | 0 | 0 | 0 | 0 | 0 | 0 | 0 | 0 | 0 | 0 | 0 |
| 2025 | - | - | - | - | - | - | - | - | - | - | - | - |
| Total | 4,581 | 4,435 | 13,893 | 3,647 | 3,919 | 7,964 | 4,470 | 4,464 | 8,768 | 5,454 | 6,016 | 11,714 |
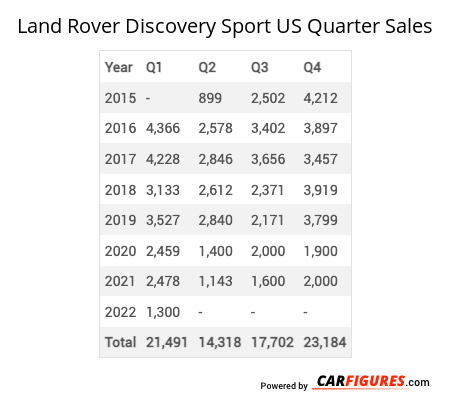
Year | Q1 | Q2 | Q3 | Q4 |
|---|---|---|---|---|
| 2015 | - | 899 | 2,502 | 4,212 |
| 2016 | 4,366 | 2,578 | 3,402 | 3,897 |
| 2017 | 4,228 | 2,846 | 3,656 | 3,457 |
| 2018 | 3,133 | 2,612 | 2,371 | 3,919 |
| 2019 | 3,527 | 2,840 | 2,171 | 3,799 |
| 2020 | 2,459 | 1,400 | 2,000 | 1,900 |
| 2021 | 2,478 | 1,143 | 1,600 | 2,000 |
| 2022 | 1,300 | 1,212 | 0 | 0 |
| 2023 | 1,418 | 0 | 0 | 0 |
| 2024 | 0 | 0 | 0 | 0 |
| 2025 | - | - | - | - |
| Total | 22,909 | 15,530 | 17,702 | 23,184 |
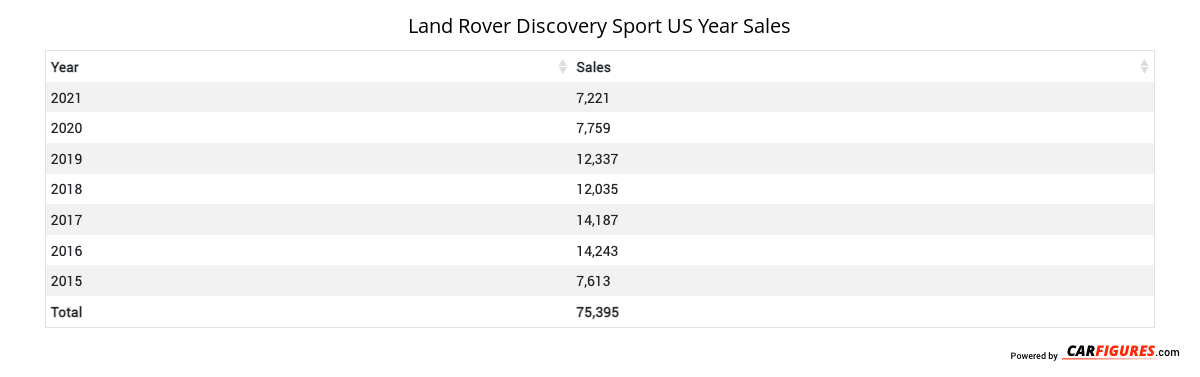
Year | Sales |
|---|---|
| 2023 | 1,418 |
| 2022 | 2,512 |
| 2021 | 7,221 |
| 2020 | 7,759 |
| 2019 | 12,337 |
| 2018 | 12,035 |
| 2017 | 14,187 |
| 2016 | 14,243 |
| 2015 | 7,613 |
| Total | 79,325 |
Download Historic Sales Data
Embedded Code
See more widgetsSources: Manufacturers