
Last updated: April 07, 2023
Land Rover Total US Sales Statistics by Year
Land Rover Total US Sales Statistics by Quarter
Current Lineup


Future Models
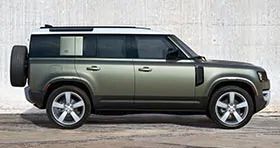
Land Rover includes the cars 2024 Defender, 2016 Discovery / LR3 / LR4, 2024 Discovery Sport, 2024 Range Rover, 2024 Range Rover Evoque, 2024 Range Rover Sport, 2024 Range Rover Velar
Loading, please wait
Year | Q1 | Q2 | Q3 | Q4 |
|---|---|---|---|---|
| 2005 | 2,515 | 3,149 | 8,362 | 9,845 |
| 2006 | 7,091 | 7,205 | 6,765 | 9,740 |
| 2007 | 6,710 | 6,439 | 7,954 | 8,202 |
| 2008 | 5,468 | 5,190 | 3,110 | 0 |
| 2009 | 1,459 | 3,944 | 4,885 | 5,962 |
| 2010 | 4,727 | 5,413 | 4,772 | 6,190 |
| 2011 | 5,743 | 6,274 | 5,828 | 8,840 |
| 2012 | 10,209 | 7,817 | 8,030 | 9,483 |
| 2013 | 9,755 | 8,200 | 9,603 | 12,044 |
| 2014 | 10,883 | 11,164 | 9,666 | 11,454 |
| 2015 | 16,919 | 15,324 | 16,086 | 22,178 |
| 2016 | 20,803 | 15,842 | 17,743 | 19,470 |
| 2017 | 19,875 | 15,964 | 18,229 | 20,258 |
| 2018 | 24,246 | 20,533 | 20,354 | 27,010 |
| 2019 | 25,028 | 21,095 | 20,516 | 28,097 |
| 2020 | 21,934 | 14,500 | 15,900 | 27,700 |
| 2021 | 21,954 | 17,255 | 18,900 | 32,600 |
| 2022 | 17,400 | 10,471 | 0 | 1,118 |
| 2023 | 14,817 | - | - | - |
Loading, please wait
Year | Sales |
|---|---|
| 2023 | 14,817 |
| 2022 | 28,989 |
| 2021 | 90,709 |
| 2020 | 80,034 |
| 2019 | 94,736 |
| 2018 | 92,143 |
| 2017 | 74,326 |
| 2016 | 73,858 |
| 2015 | 70,507 |
| 2014 | 43,167 |
| 2013 | 39,602 |
| 2012 | 35,539 |
| 2011 | 26,685 |
| 2010 | 21,102 |
| 2009 | 16,250 |
| 2008 | 13,768 |
| 2007 | 29,305 |
| 2006 | 30,801 |
| 2005 | 23,871 |
| Total | 900,209 |