

Key Stats
How many Discovery / LR3 / LR4 did Land Rover sell in 2023?
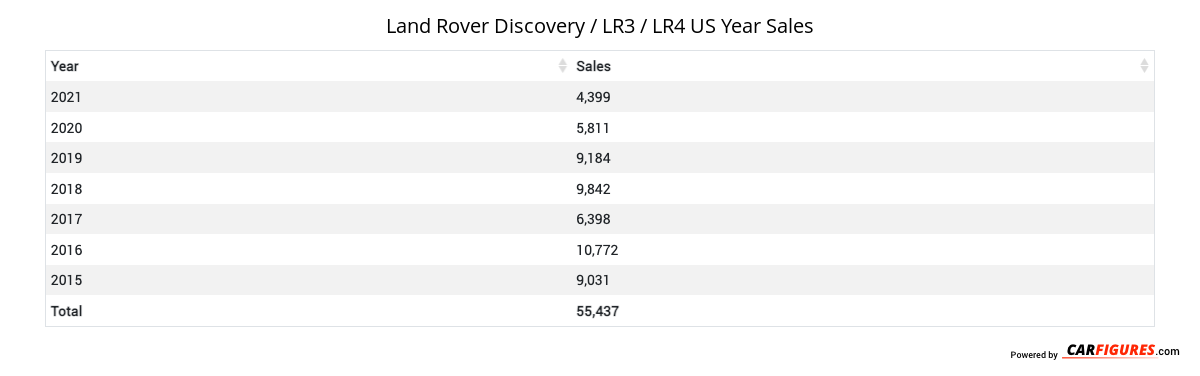
Land Rover sold 386 Discovery / LR3 / LR4 in 2023. In 2022, Land Rover sold 685 Discovery / LR3 / LR4. They sold 299 more units in year 2022 compared to 2023 with a percent loss of 43.65% YoY.
Overview
The Land Rover LR4 is a SUV with room for 5 people from automaker Land Rover.
Land Rover LR4 Engine, Transmission, and Performance Numbers
The Land Rover LR4 includes a 3.0-liter V-6 coupled with a that delivers 340 hp and torque with a 4WD drivetrain.
2016 Land Rover LR4 Fuel Economy
The 2016 Land Rover LR4 has a rating of 16 mpg combined.
List of Land Rover LR4 Competitors
Some of Land Rover LR4 competitors include the Land Rover Range Rover, Land Rover Range Rover Evoque and Jeep Grand Cherokee.
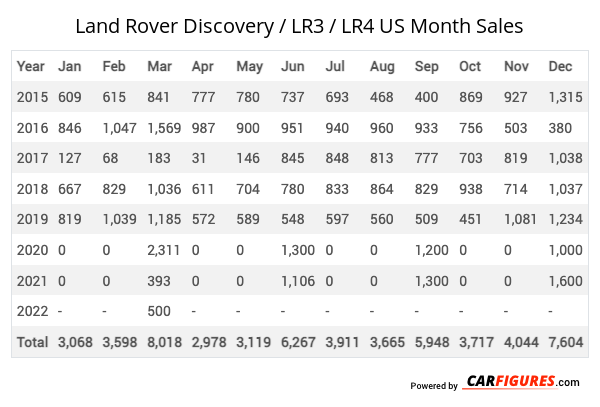
Land Rover Discovery / LR3 / LR4 United States Sale figures by year, quarter, and month are presented below. Including the most up to date sales data for the Land Rover Discovery / LR3 / LR4. See how the Land Rover Discovery / LR3 / LR4 stacks up the other models in the Crossover/SUVS, Premium Midsize Crossover/SUVs segments.
| Year | Jan | Feb | Mar | Apr | May | Jun | Jul | Aug | Sep | Oct | Nov | Dec |
|---|---|---|---|---|---|---|---|---|---|---|---|---|
| 2015 | 609 | 615 | 841 | 777 | 780 | 737 | 693 | 468 | 400 | 869 | 927 | 1315 |
| 2016 | 846 | 1047 | 1569 | 987 | 900 | 951 | 940 | 960 | 933 | 756 | 503 | 380 |
| 2017 | 127 | 68 | 183 | 31 | 146 | 845 | 848 | 813 | 777 | 703 | 819 | 1038 |
| 2018 | 667 | 829 | 1036 | 611 | 704 | 780 | 833 | 864 | 829 | 938 | 714 | 1037 |
| 2019 | 819 | 1039 | 1185 | 572 | 589 | 548 | 597 | 560 | 509 | 451 | 1081 | 1234 |
| 2020 | 0 | 0 | 2311 | 0 | 0 | 1300 | 0 | 0 | 1200 | 0 | 0 | 1000 |
| 2021 | 0 | 0 | 393 | 0 | 0 | 1106 | 0 | 0 | 1300 | 0 | 0 | 1600 |
| 2022 | 0 | 0 | 500 | 0 | 0 | 185 | 0 | 0 | 0 | 0 | 0 | 0 |
| 2023 | 0 | 0 | 386 | 0 | 0 | 0 | 0 | 0 | 0 | 0 | 0 | 0 |
| 2024 | - | - | - | - | - | - | - | - | - | - | - | - |
| Total | 3068 | 3598 | 8404 | 2978 | 3119 | 6452 | 3911 | 3665 | 5948 | 3717 | 4044 | 7604 |
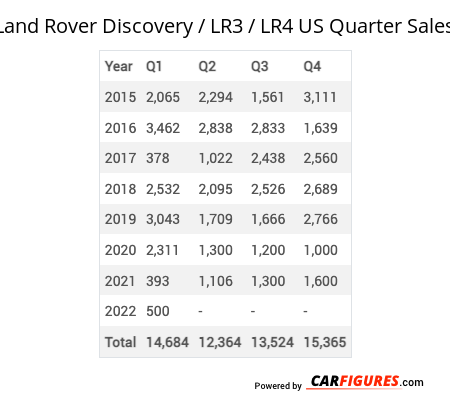
| Year | Q1 | Q2 | Q3 | Q4 |
|---|---|---|---|---|
| 2015 | 2065 | 2294 | 1561 | 3111 |
| 2016 | 3462 | 2838 | 2833 | 1639 |
| 2017 | 378 | 1022 | 2438 | 2560 |
| 2018 | 2532 | 2095 | 2526 | 2689 |
| 2019 | 3043 | 1709 | 1666 | 2766 |
| 2020 | 2311 | 1300 | 1200 | 1000 |
| 2021 | 393 | 1106 | 1300 | 1600 |
| 2022 | 500 | 185 | 0 | 0 |
| 2023 | 386 | 0 | 0 | 0 |
| 2024 | - | - | - | - |
| Total | 15070 | 12549 | 13524 | 15365 |
| Year | Sales |
|---|---|
| 2023 | 386 |
| 2022 | 685 |
| 2021 | 4399 |
| 2020 | 5811 |
| 2019 | 9184 |
| 2018 | 9842 |
| 2017 | 6398 |
| 2016 | 10772 |
| 2015 | 9031 |
| Total | 56508 |
Download Historic Sales Data
Embedded Code
See more widgetsSources: Manufacturers