
Key Stats
How many Range Rover did Land Rover sell in 2023?
Land Rover sold 2,920 Range Rover in 2023. In 2022, Land Rover sold 5,652 Range Rover. They sold 2,732 more units in year 2022 compared to 2023 with a percent loss of 48.34% YoY.
Overview
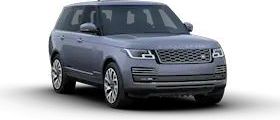
The 2024 Land Rover Range Rover is a vehicle from automaker Land Rover.
How Much Does the 2024 Land Rover Range Rover Cost?
The 2024 Land Rover Range Rover starts at $107,400 MSRP. Fully loaded, the Land Rover Range Rover will cost you about $234,000.
Land Rover Range Rover Engine, Transmission, and Performance Numbers
Land Rover Range Rover is powered by a 3.0-liter engine with a All Wheel Drive powertrain that makes 395 -hp and 406 lb-ft torque. The transmission on the Land Rover Range Rover is an ZF 8-Speed Automatic (8HP76X).
List of Land Rover Range Rover Competitors
Some of Land Rover Range Rover competitors include the Land Rover Discovery, Porsche Cayenne and Toyota Land Cruiser.
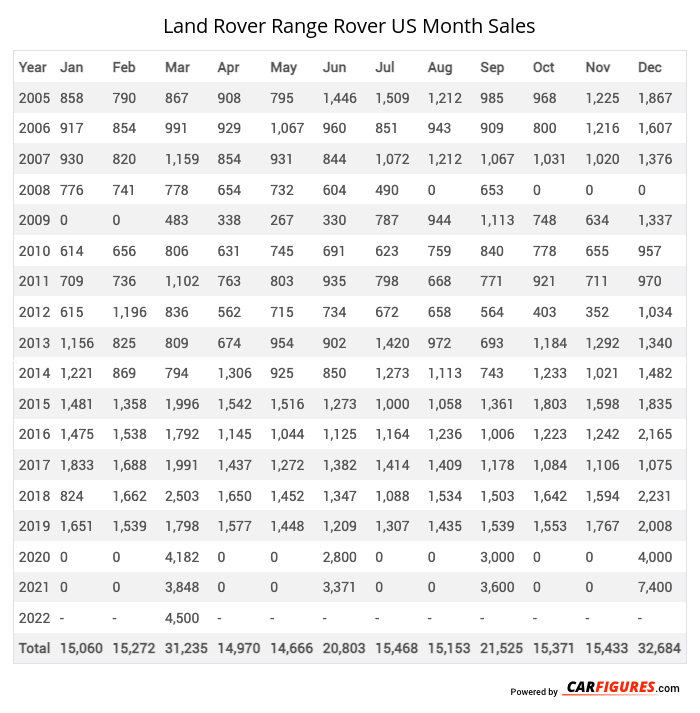
Land Rover Range Rover United States Sale figures by year, quarter, and month are presented below. Including the most up to date sales data for the Land Rover Range Rover. See how the Land Rover Range Rover stacks up the other models in the Crossover/SUVS, Premium Large SUVs segments.
| Year | Jan | Feb | Mar | Apr | May | Jun | Jul | Aug | Sep | Oct | Nov | Dec |
|---|---|---|---|---|---|---|---|---|---|---|---|---|
| 2005 | 858 | 790 | 867 | 908 | 795 | 1446 | 1509 | 1212 | 985 | 968 | 1225 | 1867 |
| 2006 | 917 | 854 | 991 | 929 | 1067 | 960 | 851 | 943 | 909 | 800 | 1216 | 1607 |
| 2007 | 930 | 820 | 1159 | 854 | 931 | 844 | 1072 | 1212 | 1067 | 1031 | 1020 | 1376 |
| 2008 | 776 | 741 | 778 | 654 | 732 | 604 | 490 | 0 | 653 | 0 | 0 | 0 |
| 2009 | 0 | 0 | 483 | 338 | 267 | 330 | 787 | 944 | 1113 | 748 | 634 | 1337 |
| 2010 | 614 | 656 | 806 | 631 | 745 | 691 | 623 | 759 | 840 | 778 | 655 | 957 |
| 2011 | 709 | 736 | 1102 | 763 | 803 | 935 | 798 | 668 | 771 | 921 | 711 | 970 |
| 2012 | 615 | 1196 | 836 | 562 | 715 | 734 | 672 | 658 | 564 | 403 | 352 | 1034 |
| 2013 | 1156 | 825 | 809 | 674 | 954 | 902 | 1420 | 972 | 693 | 1184 | 1292 | 1340 |
| 2014 | 1221 | 869 | 794 | 1306 | 925 | 850 | 1273 | 1113 | 743 | 1233 | 1021 | 1482 |
| 2015 | 1481 | 1358 | 1996 | 1542 | 1516 | 1273 | 1000 | 1058 | 1361 | 1803 | 1598 | 1835 |
| 2016 | 1475 | 1538 | 1792 | 1145 | 1044 | 1125 | 1164 | 1236 | 1006 | 1223 | 1242 | 2165 |
| 2017 | 1833 | 1688 | 1991 | 1437 | 1272 | 1382 | 1414 | 1409 | 1178 | 1084 | 1106 | 1075 |
| 2018 | 824 | 1662 | 2503 | 1650 | 1452 | 1347 | 1088 | 1534 | 1503 | 1642 | 1594 | 2231 |
| 2019 | 1651 | 1539 | 1798 | 1577 | 1448 | 1209 | 1307 | 1435 | 1539 | 1553 | 1767 | 2008 |
| 2020 | 0 | 0 | 4182 | 0 | 0 | 2800 | 0 | 0 | 3000 | 0 | 0 | 4000 |
| 2021 | 0 | 0 | 3848 | 0 | 0 | 3371 | 0 | 0 | 3600 | 0 | 0 | 7400 |
| 2022 | 0 | 0 | 4500 | 0 | 0 | 1152 | 0 | 0 | 0 | 0 | 0 | 0 |
| 2023 | 0 | 0 | 2920 | 0 | 0 | 0 | 0 | 0 | 0 | 0 | 0 | 0 |
| 2024 | - | - | - | - | - | - | - | - | - | - | - | - |
| Total | 15060 | 15272 | 34155 | 14970 | 14666 | 21955 | 15468 | 15153 | 21525 | 15371 | 15433 | 32684 |
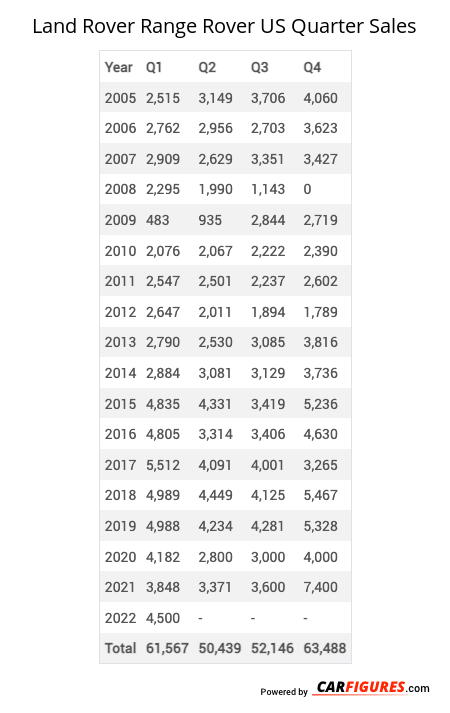
| Year | Q1 | Q2 | Q3 | Q4 |
|---|---|---|---|---|
| 2005 | 2515 | 3149 | 3706 | 4060 |
| 2006 | 2762 | 2956 | 2703 | 3623 |
| 2007 | 2909 | 2629 | 3351 | 3427 |
| 2008 | 2295 | 1990 | 1143 | 0 |
| 2009 | 483 | 935 | 2844 | 2719 |
| 2010 | 2076 | 2067 | 2222 | 2390 |
| 2011 | 2547 | 2501 | 2237 | 2602 |
| 2012 | 2647 | 2011 | 1894 | 1789 |
| 2013 | 2790 | 2530 | 3085 | 3816 |
| 2014 | 2884 | 3081 | 3129 | 3736 |
| 2015 | 4835 | 4331 | 3419 | 5236 |
| 2016 | 4805 | 3314 | 3406 | 4630 |
| 2017 | 5512 | 4091 | 4001 | 3265 |
| 2018 | 4989 | 4449 | 4125 | 5467 |
| 2019 | 4988 | 4234 | 4281 | 5328 |
| 2020 | 4182 | 2800 | 3000 | 4000 |
| 2021 | 3848 | 3371 | 3600 | 7400 |
| 2022 | 4500 | 1152 | 0 | 0 |
| 2023 | 2920 | 0 | 0 | 0 |
| 2024 | - | - | - | - |
| Total | 64487 | 51591 | 52146 | 63488 |
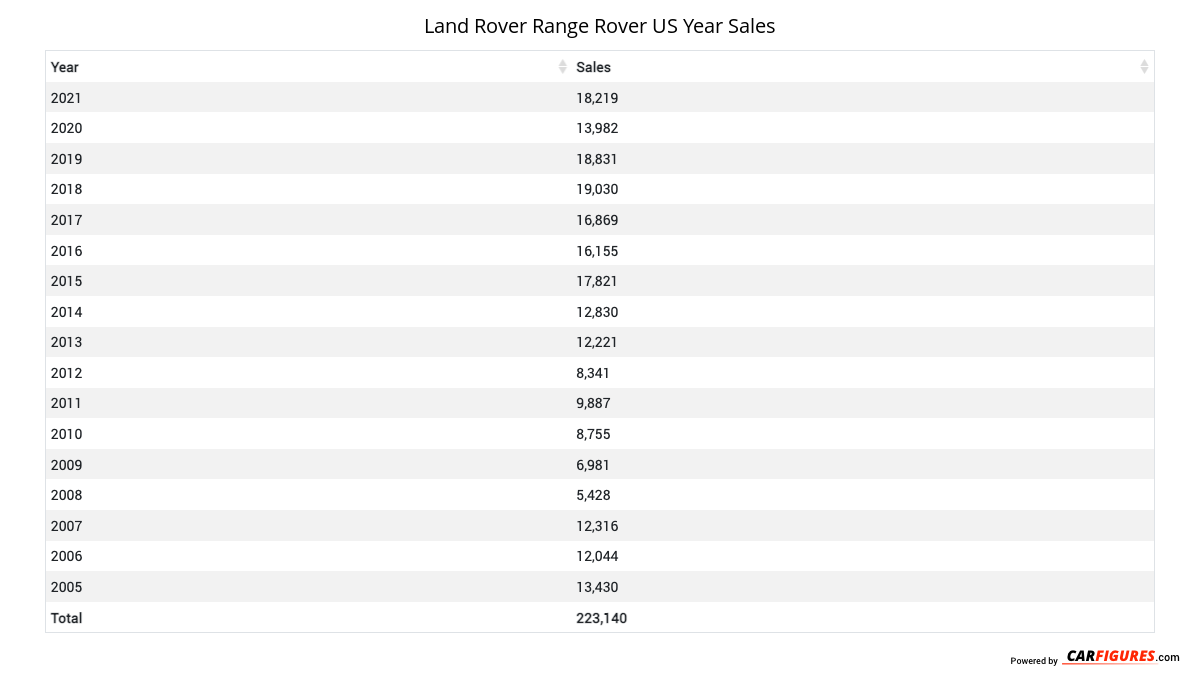
| Year | Sales |
|---|---|
| 2023 | 2920 |
| 2022 | 5652 |
| 2021 | 18219 |
| 2020 | 13982 |
| 2019 | 18831 |
| 2018 | 19030 |
| 2017 | 16869 |
| 2016 | 16155 |
| 2015 | 17821 |
| 2014 | 12830 |
| 2013 | 12221 |
| 2012 | 8341 |
| 2011 | 9887 |
| 2010 | 8755 |
| 2009 | 6981 |
| 2008 | 5428 |
| 2007 | 12316 |
| 2006 | 12044 |
| 2005 | 13430 |
| Total | 231712 |
Download Historic Sales Data
Embedded Code
See more widgetsSources: Manufacturers