Overview
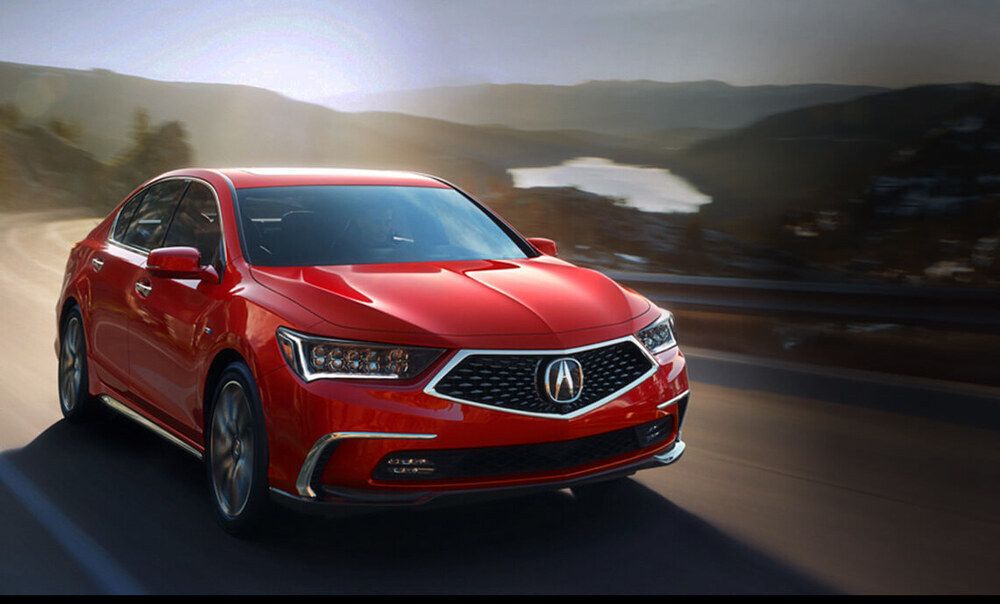
The Acura RLX is a Sedan with room for 5 people.
How Much Does the 2020 Acura RLX Cost?
The 2020 Acura RLX starts at $54,900 MSRP. Fully loaded, the Acura RLX will cost you about $54,900.
Acura RLX Engine, Transmission, and Performance Numbers
Acura RLX is powered by a 3.5-liter V-6 engine with a FWD powertrain that makes 310 -hp and torque. The transmission on the Acura RLX is an.
2020 Acura RLX Fuel Economy
The 2020 Acura RLX is expected to get 23 mpg combined.
List of Acura RLX Competitors
Some of Acura RLX competitors include the Acura TL/TLX and Honda Accord.
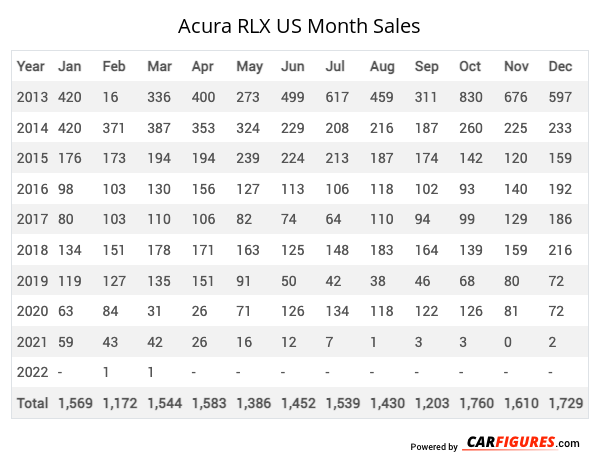
Acura RLX United States Sale figures by year, quarter, and month are presented below. Including the most up to date sales data for the Acura RLX. See how the Acura RLX stacks up the other models in the Cars, Premium Midsize Cars segments.
*Sales report includes RLX, RL
Loading, please wait
Year | Jan | Feb | Mar | Apr | May | Jun | Jul | Aug | Sep | Oct | Nov | Dec |
|---|---|---|---|---|---|---|---|---|---|---|---|---|
| 2013 | 420 | 16 | 336 | 400 | 273 | 499 | 617 | 459 | 311 | 830 | 676 | 597 |
| 2014 | 420 | 371 | 387 | 353 | 324 | 229 | 208 | 216 | 187 | 260 | 225 | 233 |
| 2015 | 176 | 173 | 194 | 194 | 239 | 224 | 213 | 187 | 174 | 142 | 120 | 159 |
| 2016 | 98 | 103 | 130 | 156 | 127 | 113 | 106 | 118 | 102 | 93 | 140 | 192 |
| 2017 | 80 | 103 | 110 | 106 | 82 | 74 | 64 | 110 | 94 | 99 | 129 | 186 |
| 2018 | 134 | 151 | 178 | 171 | 163 | 125 | 148 | 183 | 164 | 139 | 159 | 216 |
| 2019 | 119 | 127 | 135 | 151 | 91 | 50 | 42 | 38 | 46 | 68 | 80 | 72 |
| 2020 | 63 | 84 | 31 | 26 | 71 | 126 | 134 | 118 | 122 | 126 | 81 | 72 |
| 2021 | 59 | 43 | 42 | 26 | 16 | 12 | 7 | 1 | 3 | 3 | 0 | 2 |
| 2022 | 0 | 1 | 1 | 1 | 0 | 0 | 0 | 0 | 0 | 0 | 0 | 0 |
| 2023 | 0 | 0 | 0 | 0 | 0 | 0 | 0 | 0 | 0 | 0 | 0 | 0 |
| 2024 | 0 | 0 | 0 | 0 | 0 | 0 | 0 | 0 | 0 | 0 | 0 | 0 |
| 2025 | - | - | - | - | - | - | - | - | - | - | - | - |
| Total | 1,569 | 1,172 | 1,544 | 1,584 | 1,386 | 1,452 | 1,539 | 1,430 | 1,203 | 1,760 | 1,610 | 1,729 |
Loading, please wait
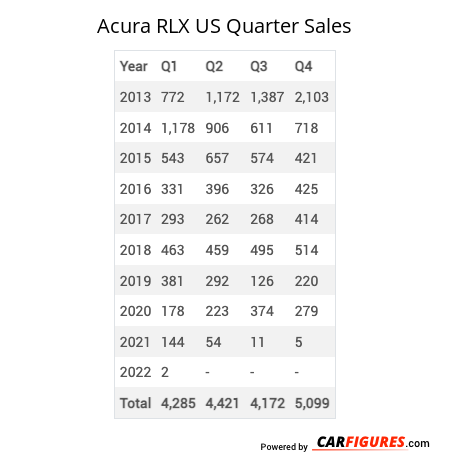
Year | Q1 | Q2 | Q3 | Q4 |
|---|---|---|---|---|
| 2013 | 772 | 1,172 | 1,387 | 2,103 |
| 2014 | 1,178 | 906 | 611 | 718 |
| 2015 | 543 | 657 | 574 | 421 |
| 2016 | 331 | 396 | 326 | 425 |
| 2017 | 293 | 262 | 268 | 414 |
| 2018 | 463 | 459 | 495 | 514 |
| 2019 | 381 | 292 | 126 | 220 |
| 2020 | 178 | 223 | 374 | 279 |
| 2021 | 144 | 54 | 11 | 5 |
| 2022 | 2 | 1 | 0 | 0 |
| 2023 | 0 | 0 | 0 | 0 |
| 2024 | - | - | - | - |
| Total | 4,285 | 4,422 | 4,172 | 5,099 |
Loading, please wait
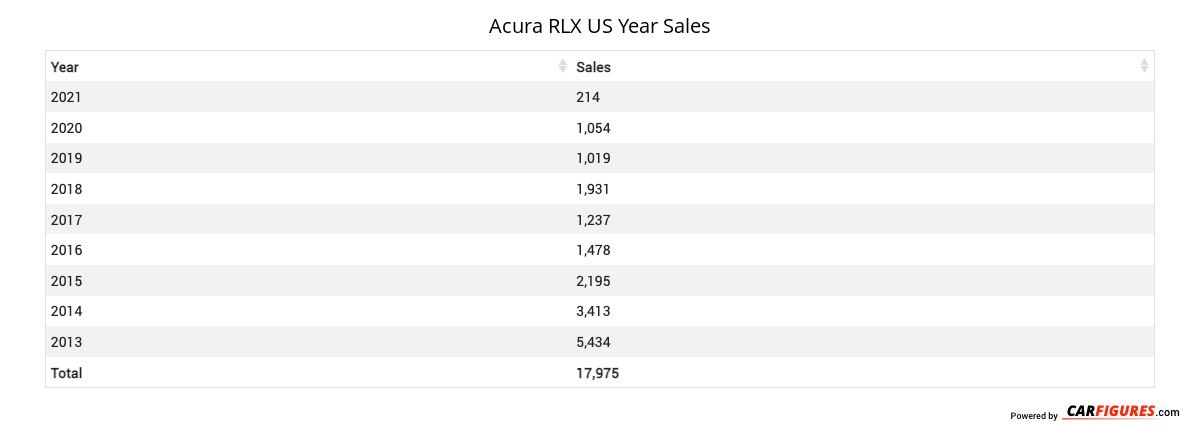
Year | Sales |
|---|---|
| 2022 | 3 |
| 2021 | 214 |
| 2020 | 1,054 |
| 2019 | 1,019 |
| 2018 | 1,931 |
| 2017 | 1,237 |
| 2016 | 1,478 |
| 2015 | 2,195 |
| 2014 | 3,413 |
| 2013 | 5,434 |
| Total | 17,978 |
Download Historic Sales Data
Embedded Code
See more widgetsSources: Manufacturers