
Key Stats
How many MDX did Acura sell in 2025?
Acura sold 10,641 MDX in 2025. (From Jan - Mar 2025)
How many MDX did Acura sell in March 2025?
Acura sold 4,212 MDX in March 2025.
How many MDX did Acura sell in 2024?
Acura sold 40,976 MDX in 2024. In 2023, Acura sold 57,599 MDX. They sold 16,623 more units in year 2023 compared to 2024 with a percent loss of 28.86% YoY.
Overview
The 2024 Acura MDX is a vehicle from automaker Acura.
How Much Does the 2024 Acura MDX Cost?
Pricing for the 2024 Acura MDX starts at $54,550 MSRP and goes up to $73,500 fully loaded.
Acura MDX Engine, Transmission, and Performance Numbers
Acura MDX includes a 3.5-liter engine combined with a 10-Speed Automatic. This delivers 290 hp with 267 lb-ft torque delivered through a Front Wheel Drive drivetrain.
List of Acura MDX Competitors
Some of Acura MDX competitors include the Acura RDX, Honda Pilot and Audi Q7.
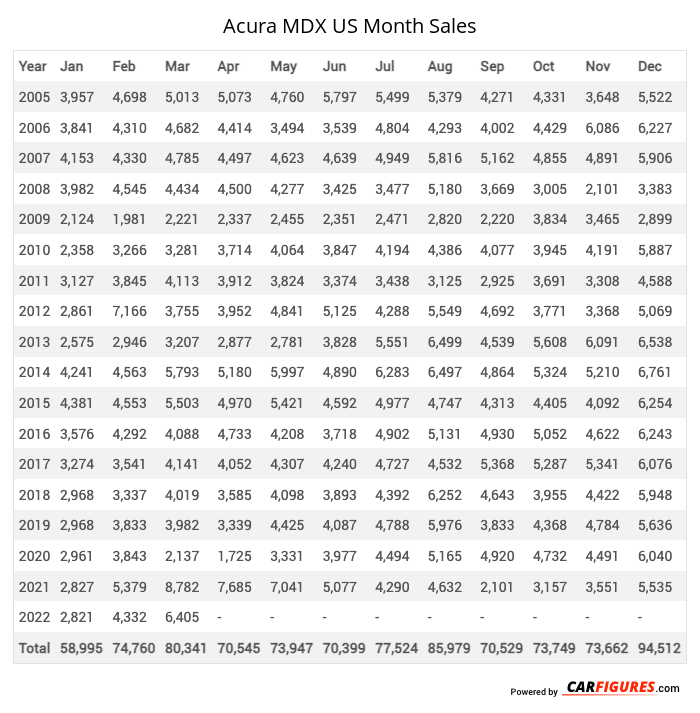
Acura MDX United States Sale figures by year, quarter, and month are presented below. Including the most up to date sales data for the Acura MDX. See how the Acura MDX stacks up the other models in the Crossover/SUVS, Premium Midsize Crossover/SUVs segments.
Year | Jan | Feb | Mar | Apr | May | Jun | Jul | Aug | Sep | Oct | Nov | Dec |
|---|---|---|---|---|---|---|---|---|---|---|---|---|
| 2005 | 3,957 | 4,698 | 5,013 | 5,073 | 4,760 | 5,797 | 5,499 | 5,379 | 4,271 | 4,331 | 3,648 | 5,522 |
| 2006 | 3,841 | 4,310 | 4,682 | 4,414 | 3,494 | 3,539 | 4,804 | 4,293 | 4,002 | 4,429 | 6,086 | 6,227 |
| 2007 | 4,153 | 4,330 | 4,785 | 4,497 | 4,623 | 4,639 | 4,949 | 5,816 | 5,162 | 4,855 | 4,891 | 5,906 |
| 2008 | 3,982 | 4,545 | 4,434 | 4,500 | 4,277 | 3,425 | 3,477 | 5,180 | 3,669 | 3,005 | 2,101 | 3,383 |
| 2009 | 2,124 | 1,981 | 2,221 | 2,337 | 2,455 | 2,351 | 2,471 | 2,820 | 2,220 | 3,834 | 3,465 | 2,899 |
| 2010 | 2,358 | 3,266 | 3,281 | 3,714 | 4,064 | 3,847 | 4,194 | 4,386 | 4,077 | 3,945 | 4,191 | 5,887 |
| 2011 | 3,127 | 3,845 | 4,113 | 3,912 | 3,824 | 3,374 | 3,438 | 3,125 | 2,925 | 3,691 | 3,308 | 4,588 |
| 2012 | 2,861 | 7,166 | 3,755 | 3,952 | 4,841 | 5,125 | 4,288 | 5,549 | 4,692 | 3,771 | 3,368 | 5,069 |
| 2013 | 2,575 | 2,946 | 3,207 | 2,877 | 2,781 | 3,828 | 5,551 | 6,499 | 4,539 | 5,608 | 6,091 | 6,538 |
| 2014 | 4,241 | 4,563 | 5,793 | 5,180 | 5,997 | 4,890 | 6,283 | 6,497 | 4,864 | 5,324 | 5,210 | 6,761 |
| 2015 | 4,381 | 4,553 | 5,503 | 4,970 | 5,421 | 4,592 | 4,977 | 4,747 | 4,313 | 4,405 | 4,092 | 6,254 |
| 2016 | 3,576 | 4,292 | 4,088 | 4,733 | 4,208 | 3,718 | 4,902 | 5,131 | 4,930 | 5,052 | 4,622 | 6,243 |
| 2017 | 3,274 | 3,541 | 4,141 | 4,052 | 4,307 | 4,240 | 4,727 | 4,532 | 5,368 | 5,287 | 5,341 | 6,076 |
| 2018 | 2,968 | 3,337 | 4,019 | 3,585 | 4,098 | 3,893 | 4,392 | 6,252 | 4,643 | 3,955 | 4,422 | 5,948 |
| 2019 | 2,968 | 3,833 | 3,982 | 3,339 | 4,425 | 4,087 | 4,788 | 5,976 | 3,833 | 4,368 | 4,784 | 5,636 |
| 2020 | 2,961 | 3,843 | 2,137 | 1,725 | 3,331 | 3,977 | 4,494 | 5,165 | 4,920 | 4,732 | 4,491 | 6,040 |
| 2021 | 2,827 | 5,379 | 8,782 | 7,685 | 7,041 | 5,077 | 4,290 | 4,632 | 2,101 | 3,157 | 3,551 | 5,535 |
| 2022 | 2,821 | 4,332 | 6,405 | 4,735 | 2,794 | 2,523 | 2,150 | 3,368 | 4,086 | 4,050 | 4,028 | 5,133 |
| 2023 | 4,455 | 4,692 | 6,076 | 5,758 | 5,935 | 5,048 | 4,397 | 4,172 | 4,386 | 3,638 | 4,074 | 4,968 |
| 2024 | 3,111 | 3,650 | 4,380 | 0 | 6,322 | 4,130 | 3,845 | 4,032 | 3,274 | 3,904 | 4,328 | 0 |
| 2025 | 2,966 | 3,463 | 4,212 | - | - | - | - | - | - | - | - | - |
| Total | 69,527 | 86,565 | 95,009 | 81,038 | 88,998 | 82,100 | 87,916 | 97,551 | 82,275 | 85,341 | 86,092 | 104,613 |
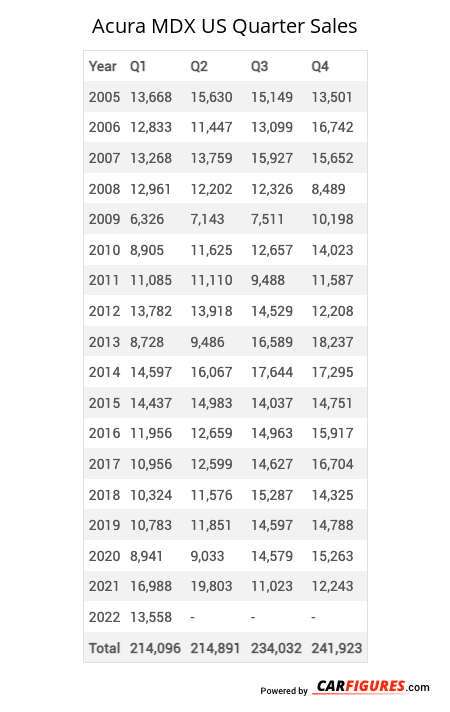
Year | Q1 | Q2 | Q3 | Q4 |
|---|---|---|---|---|
| 2005 | 13,668 | 15,630 | 15,149 | 13,501 |
| 2006 | 12,833 | 11,447 | 13,099 | 16,742 |
| 2007 | 13,268 | 13,759 | 15,927 | 15,652 |
| 2008 | 12,961 | 12,202 | 12,326 | 8,489 |
| 2009 | 6,326 | 7,143 | 7,511 | 10,198 |
| 2010 | 8,905 | 11,625 | 12,657 | 14,023 |
| 2011 | 11,085 | 11,110 | 9,488 | 11,587 |
| 2012 | 13,782 | 13,918 | 14,529 | 12,208 |
| 2013 | 8,728 | 9,486 | 16,589 | 18,237 |
| 2014 | 14,597 | 16,067 | 17,644 | 17,295 |
| 2015 | 14,437 | 14,983 | 14,037 | 14,751 |
| 2016 | 11,956 | 12,659 | 14,963 | 15,917 |
| 2017 | 10,956 | 12,599 | 14,627 | 16,704 |
| 2018 | 10,324 | 11,576 | 15,287 | 14,325 |
| 2019 | 10,783 | 11,851 | 14,597 | 14,788 |
| 2020 | 8,941 | 9,033 | 14,579 | 15,263 |
| 2021 | 16,988 | 19,803 | 11,023 | 12,243 |
| 2022 | 13,558 | 10,052 | 9,604 | 13,211 |
| 2023 | 15,223 | 16,741 | 12,955 | 12,680 |
| 2024 | 11,141 | 10,452 | 11,151 | 8,232 |
| 2025 | 10,641 | - | - | - |
| Total | 251,101 | 252,136 | 267,742 | 276,046 |
Year | Sales |
|---|---|
| 2024 | 40,976 |
| 2023 | 57,599 |
| 2022 | 46,425 |
| 2021 | 60,057 |
| 2020 | 47,816 |
| 2019 | 52,019 |
| 2018 | 51,512 |
| 2017 | 54,886 |
| 2016 | 55,495 |
| 2015 | 58,208 |
| 2014 | 65,603 |
| 2013 | 53,040 |
| 2012 | 54,437 |
| 2011 | 43,270 |
| 2010 | 47,210 |
| 2009 | 31,178 |
| 2008 | 45,978 |
| 2007 | 58,606 |
| 2006 | 54,121 |
| 2005 | 57,948 |
| Total | 1,036,384 |
Download Historic Sales Data

Embedded Code
See more widgetsSources: Manufacturers