Last updated: April 03, 2025
Key Stats
How many cars did Acura sell in 2024?
Acura sold 83,143 vehicles in 2024. In 2023, Acura sold 113,565 vehicles. They sold 30,422 more vehicles in year 2023 compared to 2024 with a percent loss of 26.79% YoY.
Acura Total US Sales Statistics by Year
Acura Total US Sales Statistics by Quarter
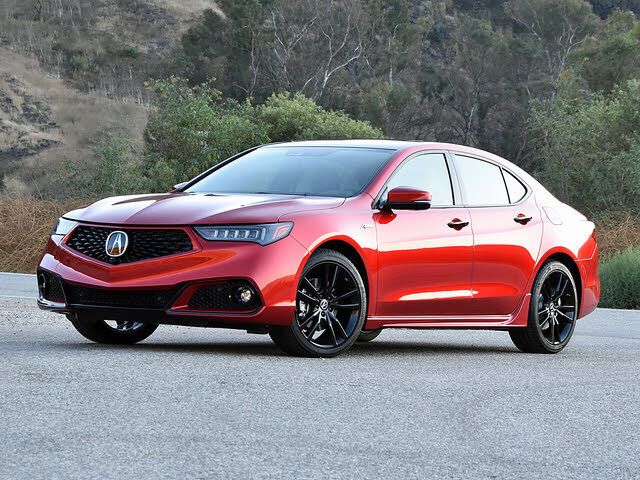
Current Lineup
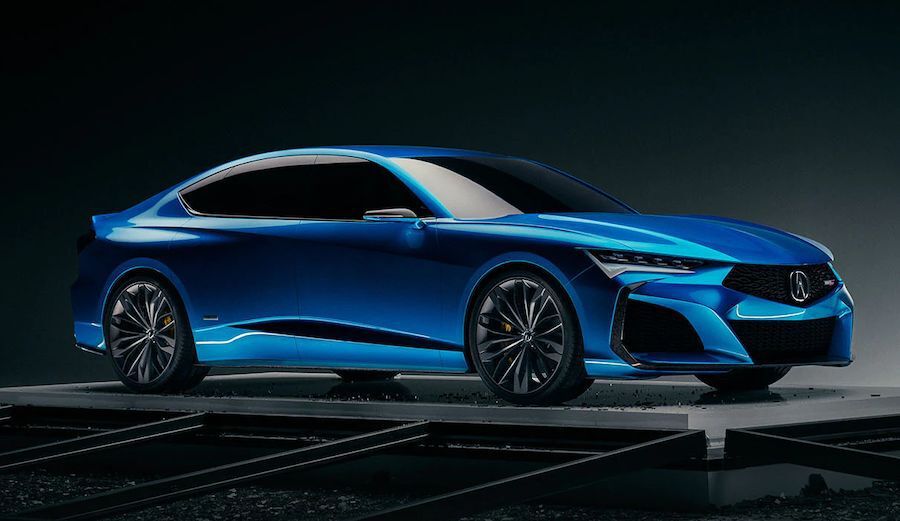
Future Models
Discontinued Models
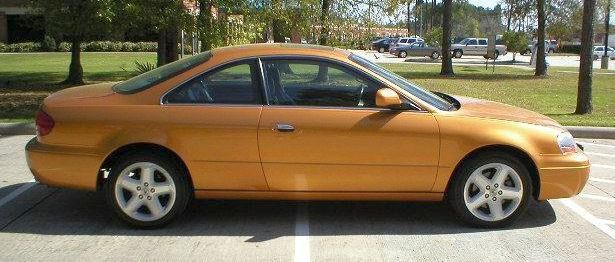
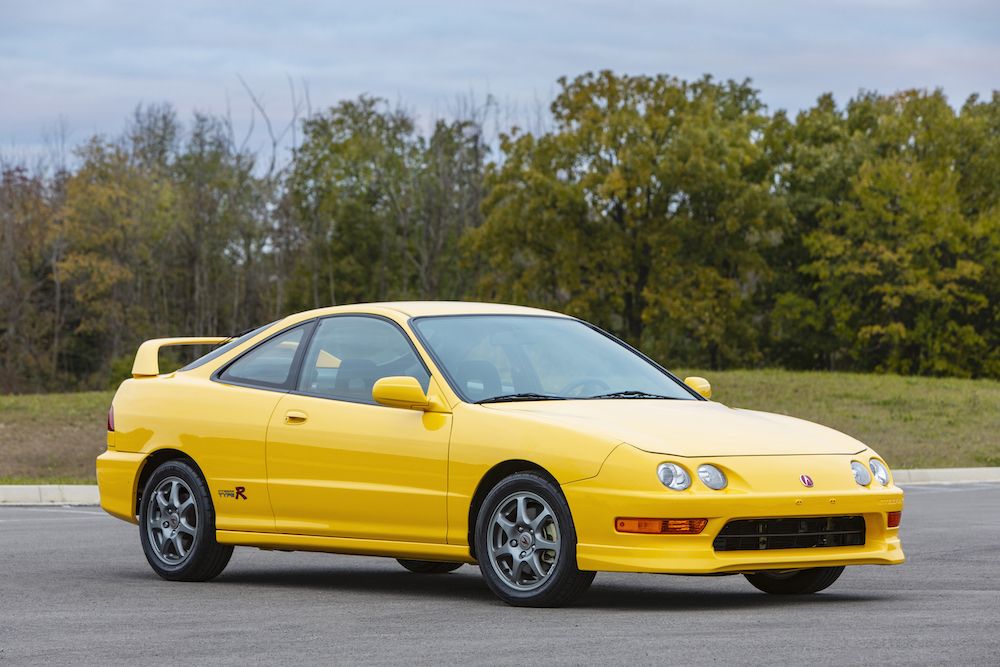
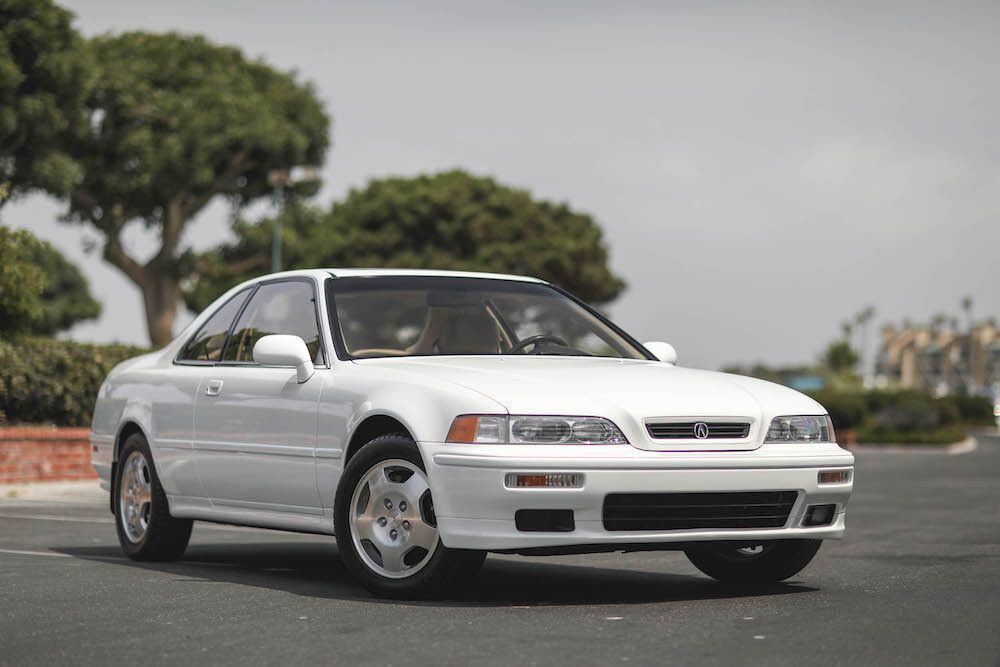
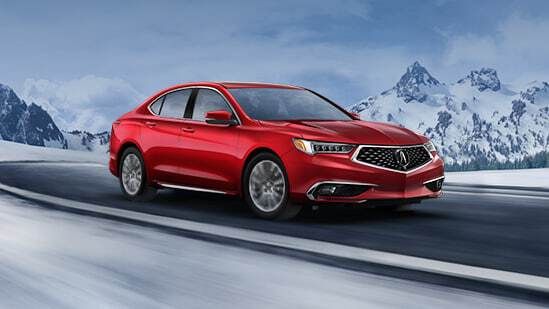
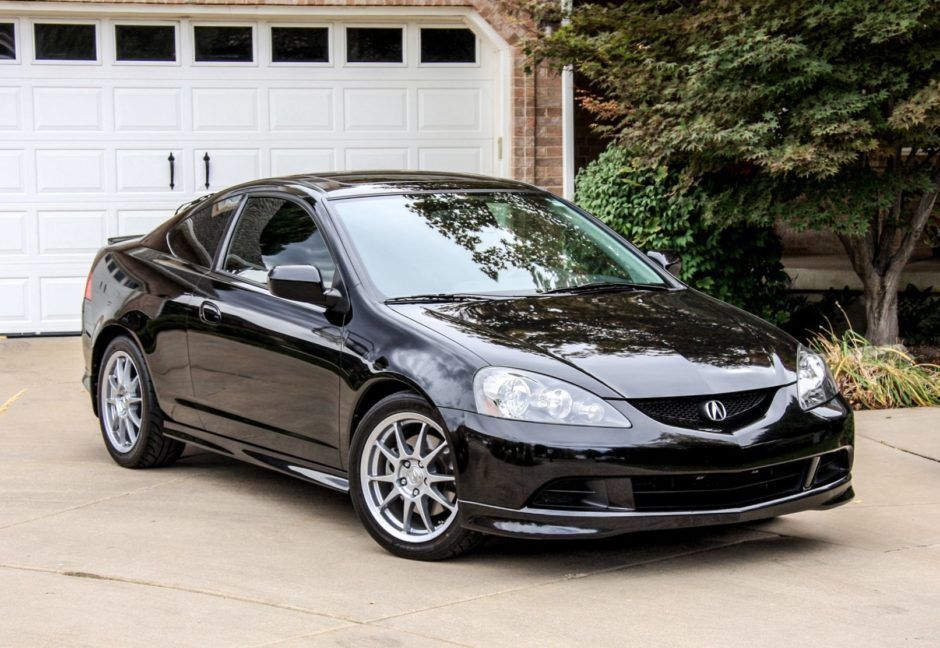
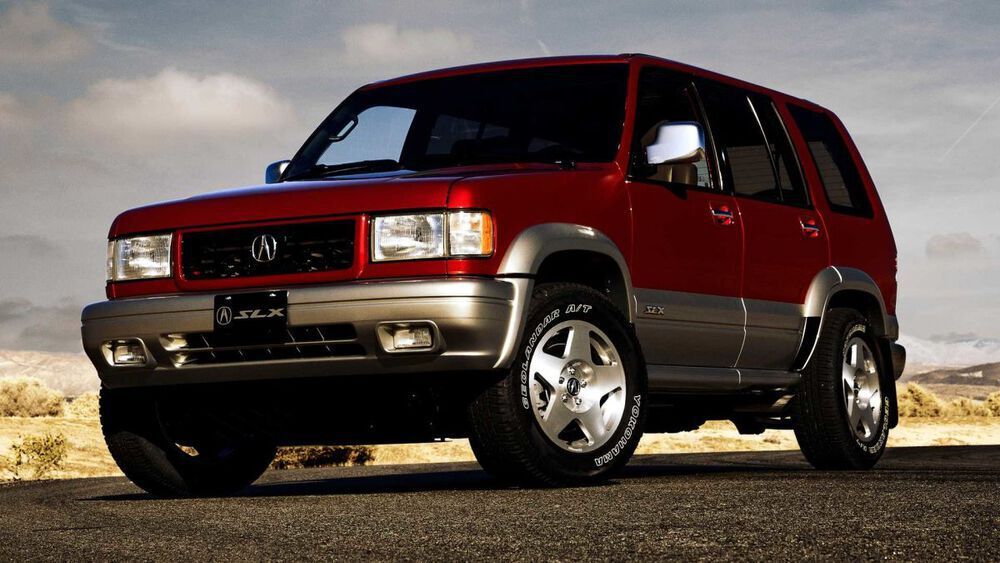
Acura includes the cars 2003 CL, 2024 ILX, 2001 Integra, 1995 Legend, 2024 MDX, 2024 NSX, 2024 RDX, 2012 RL, 2024 RLX, 2006 RSX, 1999 SLX, 2024 TLX, 2014 TSX, Type S, 2013 ZDX
Loading, please wait
Year | Q1 | Q2 | Q3 | Q4 |
|---|---|---|---|---|
| 2005 | 34,669 | 40,321 | 40,641 | 33,339 |
| 2006 | 31,449 | 34,215 | 38,233 | 37,855 |
| 2007 | 31,504 | 32,483 | 32,595 | 31,520 |
| 2008 | 27,237 | 30,195 | 27,034 | 18,320 |
| 2009 | 17,037 | 17,570 | 17,630 | 21,909 |
| 2010 | 19,884 | 25,323 | 27,357 | 29,020 |
| 2011 | 23,861 | 22,230 | 21,153 | 25,913 |
| 2012 | 26,098 | 32,610 | 34,157 | 33,730 |
| 2013 | 28,599 | 34,238 | 38,677 | 40,050 |
| 2014 | 33,096 | 34,212 | 40,458 | 47,834 |
| 2015 | 37,712 | 47,418 | 44,927 | 45,144 |
| 2016 | 37,875 | 41,119 | 40,732 | 41,633 |
| 2017 | 31,762 | 42,109 | 40,255 | 40,476 |
| 2018 | 33,414 | 39,239 | 41,830 | 44,451 |
| 2019 | 36,385 | 37,382 | 39,046 | 44,572 |
| 2020 | 28,531 | 27,458 | 39,664 | 41,329 |
| 2021 | 37,888 | 50,496 | 38,555 | 30,469 |
| 2022 | 28,236 | 23,128 | 17,250 | 20,665 |
| 2023 | 25,759 | 31,369 | 28,573 | 27,864 |
| 2024 | 23,788 | - | - | - |
Loading, please wait
Year | Sales |
|---|---|
| 2024 | 83,143 |
| 2023 | 113,565 |
| 2022 | 89,279 |
| 2021 | 157,408 |
| 2020 | 136,982 |
| 2019 | 157,385 |
| 2018 | 158,934 |
| 2017 | 154,602 |
| 2016 | 161,359 |
| 2015 | 175,201 |
| 2014 | 155,600 |
| 2013 | 141,564 |
| 2012 | 126,595 |
| 2011 | 93,157 |
| 2010 | 101,584 |
| 2009 | 74,146 |
| 2008 | 102,786 |
| 2007 | 128,102 |
| 2006 | 141,752 |
| 2005 | 148,970 |
| Total | 2,602,114 |