Key Stats
How many TLX did Acura sell in 2025?
Acura sold 792 TLX in 2025. (From Jan - Feb 2025)
How many TLX did Acura sell in February 2025?
Acura sold 438 TLX in February 2025.
How many TLX did Acura sell in 2024?
Acura sold 6,343 TLX in 2024. In 2023, Acura sold 16,731 TLX. They sold 10,388 more units in year 2023 compared to 2024 with a percent loss of 62.09% YoY.
Overview
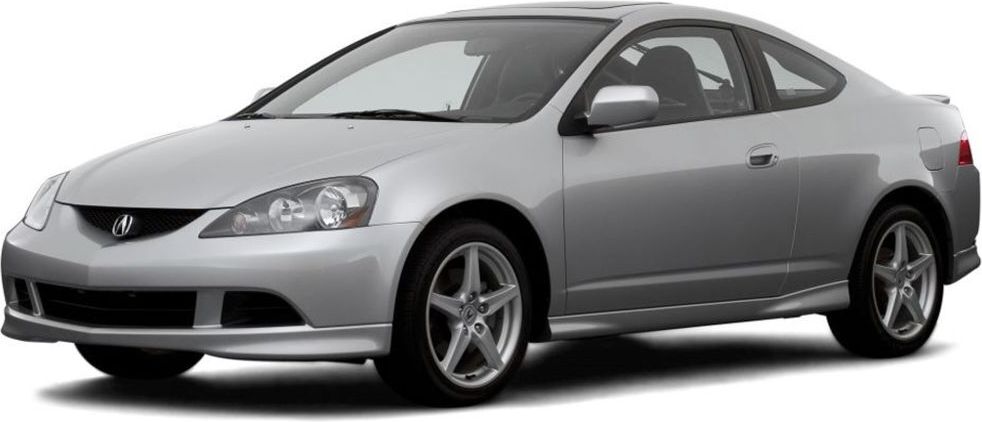
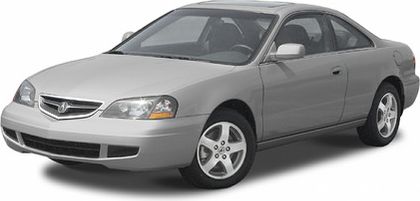
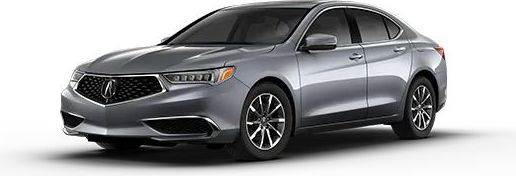
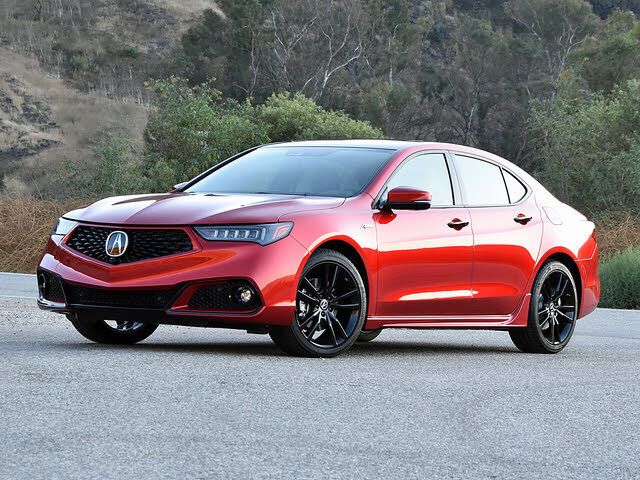
The Acura TLX is a Sedan with room for 5 people from automaker Acura.
How Much Does the 2020 Acura TLX Cost?
Pricing for the 2020 Acura TLX starts at $33,000 MSRP and goes up to $48,950 fully loaded.
Acura TLX Engine, Transmission, and Performance Numbers
Acura TLX includes a 2.4-liter I-4 engine combined with an 8-speed auto-shift manual. This delivers 206 hp with 182 lbs.-ft. Torque delivered through a FWD drivetrain.
2020 Acura TLX Fuel Economy
The 2020 Acura TLX has a rating of 27 mpg combined. The 2020 Acura TLX can hold 17 gallons of fuel for a combined range of 459 miles.
2020 Acura TLX Specifications
The has a curb weight of 3,505 lbs. With an interior passenger volume of 93.3 cu. Ft.
List of Acura TLX Competitors
Some of Acura TLX competitors include the Honda Accord, Infiniti Q50 and BMW 3-Series.
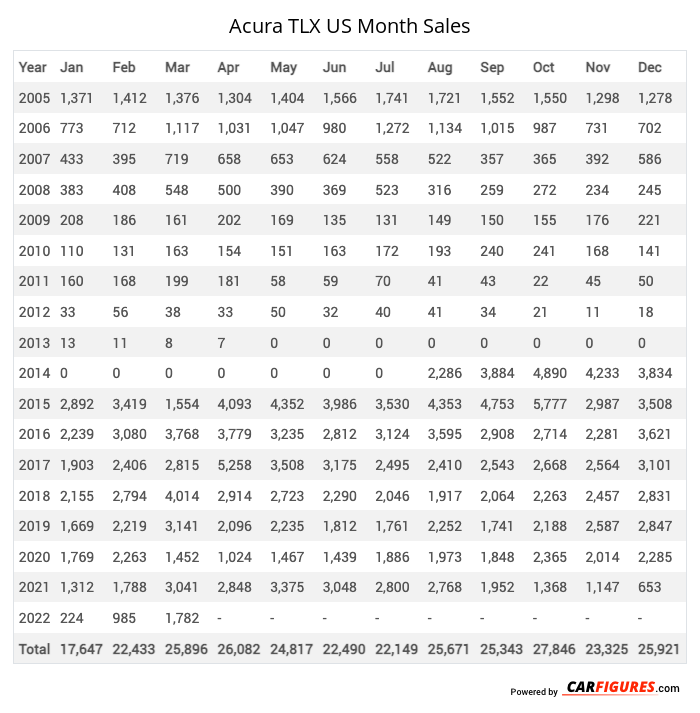
Acura TLX United States Sale figures by year, quarter, and month are presented below. Including the most up to date sales data for the Acura TLX. See how the Acura TLX stacks up the other models in the Cars, Premium Midsize Cars segments.
Year | Jan | Feb | Mar | Apr | May | Jun | Jul | Aug | Sep | Oct | Nov | Dec |
|---|---|---|---|---|---|---|---|---|---|---|---|---|
| 2005 | 1,371 | 1,412 | 1,376 | 1,304 | 1,404 | 1,566 | 1,741 | 1,721 | 1,552 | 1,550 | 1,298 | 1,278 |
| 2006 | 773 | 712 | 1,117 | 1,031 | 1,047 | 980 | 1,272 | 1,134 | 1,015 | 987 | 731 | 702 |
| 2007 | 433 | 395 | 719 | 658 | 653 | 624 | 558 | 522 | 357 | 365 | 392 | 586 |
| 2008 | 383 | 408 | 548 | 500 | 390 | 369 | 523 | 316 | 259 | 272 | 234 | 245 |
| 2009 | 208 | 186 | 161 | 202 | 169 | 135 | 131 | 149 | 150 | 155 | 176 | 221 |
| 2010 | 110 | 131 | 163 | 154 | 151 | 163 | 172 | 193 | 240 | 241 | 168 | 141 |
| 2011 | 160 | 168 | 199 | 181 | 58 | 59 | 70 | 41 | 43 | 22 | 45 | 50 |
| 2012 | 33 | 56 | 38 | 33 | 50 | 32 | 40 | 41 | 34 | 21 | 11 | 18 |
| 2013 | 13 | 11 | 8 | 7 | 0 | 0 | 0 | 0 | 0 | 0 | 0 | 0 |
| 2014 | 0 | 0 | 0 | 0 | 0 | 0 | 0 | 2,286 | 3,884 | 4,890 | 4,233 | 3,834 |
| 2015 | 2,892 | 3,419 | 1,554 | 4,093 | 4,352 | 3,986 | 3,530 | 4,353 | 4,753 | 5,777 | 2,987 | 3,508 |
| 2016 | 2,239 | 3,080 | 3,768 | 3,779 | 3,235 | 2,812 | 3,124 | 3,595 | 2,908 | 2,714 | 2,281 | 3,621 |
| 2017 | 1,903 | 2,406 | 2,815 | 5,258 | 3,508 | 3,175 | 2,495 | 2,410 | 2,543 | 2,668 | 2,564 | 3,101 |
| 2018 | 2,155 | 2,794 | 4,014 | 2,914 | 2,723 | 2,290 | 2,046 | 1,917 | 2,064 | 2,263 | 2,457 | 2,831 |
| 2019 | 1,669 | 2,219 | 3,141 | 2,096 | 2,235 | 1,812 | 1,761 | 2,252 | 1,741 | 2,188 | 2,587 | 2,847 |
| 2020 | 1,769 | 2,263 | 1,452 | 1,024 | 1,467 | 1,439 | 1,886 | 1,973 | 1,848 | 2,365 | 2,014 | 2,285 |
| 2021 | 1,312 | 1,788 | 3,041 | 2,848 | 3,375 | 3,048 | 2,800 | 2,768 | 1,952 | 1,368 | 1,147 | 653 |
| 2022 | 224 | 985 | 1,782 | 1,921 | 1,146 | 1,064 | 859 | 602 | 571 | 866 | 674 | 814 |
| 2023 | 990 | 1,121 | 1,609 | 1,576 | 2,173 | 2,013 | 1,631 | 1,231 | 1,229 | 980 | 1,085 | 1,093 |
| 2024 | 883 | 725 | 922 | 0 | 532 | 478 | 616 | 576 | 548 | 536 | 527 | 0 |
| 2025 | 354 | 438 | - | - | - | - | - | - | - | - | - | - |
| Total | 19,874 | 24,717 | 28,427 | 29,579 | 28,668 | 26,045 | 25,255 | 28,080 | 27,691 | 30,228 | 25,611 | 27,828 |
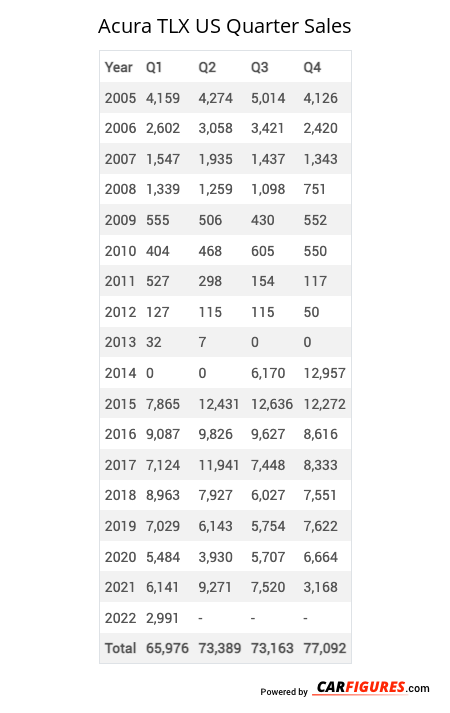
Year | Q1 | Q2 | Q3 | Q4 |
|---|---|---|---|---|
| 2005 | 4,159 | 4,274 | 5,014 | 4,126 |
| 2006 | 2,602 | 3,058 | 3,421 | 2,420 |
| 2007 | 1,547 | 1,935 | 1,437 | 1,343 |
| 2008 | 1,339 | 1,259 | 1,098 | 751 |
| 2009 | 555 | 506 | 430 | 552 |
| 2010 | 404 | 468 | 605 | 550 |
| 2011 | 527 | 298 | 154 | 117 |
| 2012 | 127 | 115 | 115 | 50 |
| 2013 | 32 | 7 | 0 | 0 |
| 2014 | 0 | 0 | 6,170 | 12,957 |
| 2015 | 7,865 | 12,431 | 12,636 | 12,272 |
| 2016 | 9,087 | 9,826 | 9,627 | 8,616 |
| 2017 | 7,124 | 11,941 | 7,448 | 8,333 |
| 2018 | 8,963 | 7,927 | 6,027 | 7,551 |
| 2019 | 7,029 | 6,143 | 5,754 | 7,622 |
| 2020 | 5,484 | 3,930 | 5,707 | 6,664 |
| 2021 | 6,141 | 9,271 | 7,520 | 3,168 |
| 2022 | 2,991 | 4,131 | 2,032 | 2,354 |
| 2023 | 3,720 | 5,762 | 4,091 | 3,158 |
| 2024 | 2,530 | 1,010 | 1,740 | 1,063 |
| Total | 72,226 | 84,292 | 81,026 | 83,667 |
Year | Sales |
|---|---|
| 2024 | 6,343 |
| 2023 | 16,731 |
| 2022 | 11,508 |
| 2021 | 26,100 |
| 2020 | 21,785 |
| 2019 | 26,548 |
| 2018 | 30,468 |
| 2017 | 34,846 |
| 2016 | 37,156 |
| 2015 | 45,204 |
| 2014 | 19,127 |
| 2013 | 39 |
| 2012 | 407 |
| 2011 | 1,096 |
| 2010 | 2,027 |
| 2009 | 2,043 |
| 2008 | 4,447 |
| 2007 | 6,262 |
| 2006 | 11,501 |
| 2005 | 17,573 |
| Total | 321,211 |
Download Historic Sales Data

Embedded Code
See more widgetsSources: Manufacturers