Key Stats
How many 2008 did Peugeot sell in 2020?
Peugeot sold 696 2008 in 2020. (From Jan - Dec 2020)
How many 2008 did Peugeot sell in July 2020?
Peugeot sold 64 2008 in July 2020.
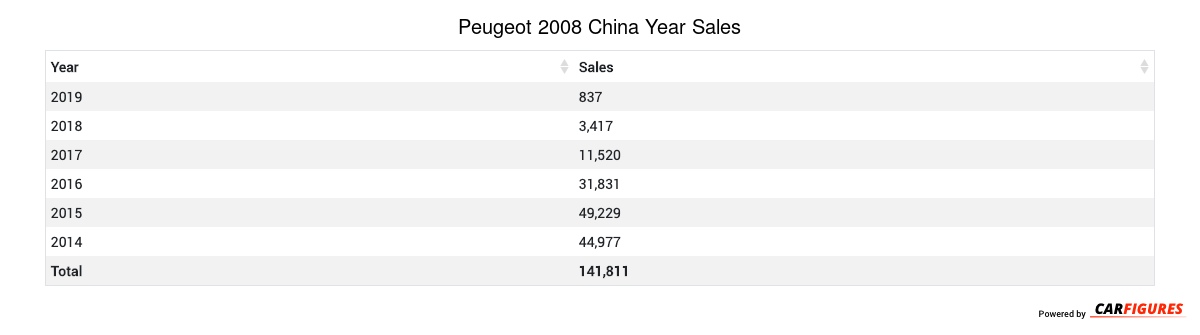
How many 2008 did Peugeot sell in 2019?
Peugeot sold 837 2008 in 2019. In 2018, Peugeot sold 3,417 2008. They sold 2,580 more units in year 2018 compared to 2019 with a percent loss of 75.5% YoY.
Overview
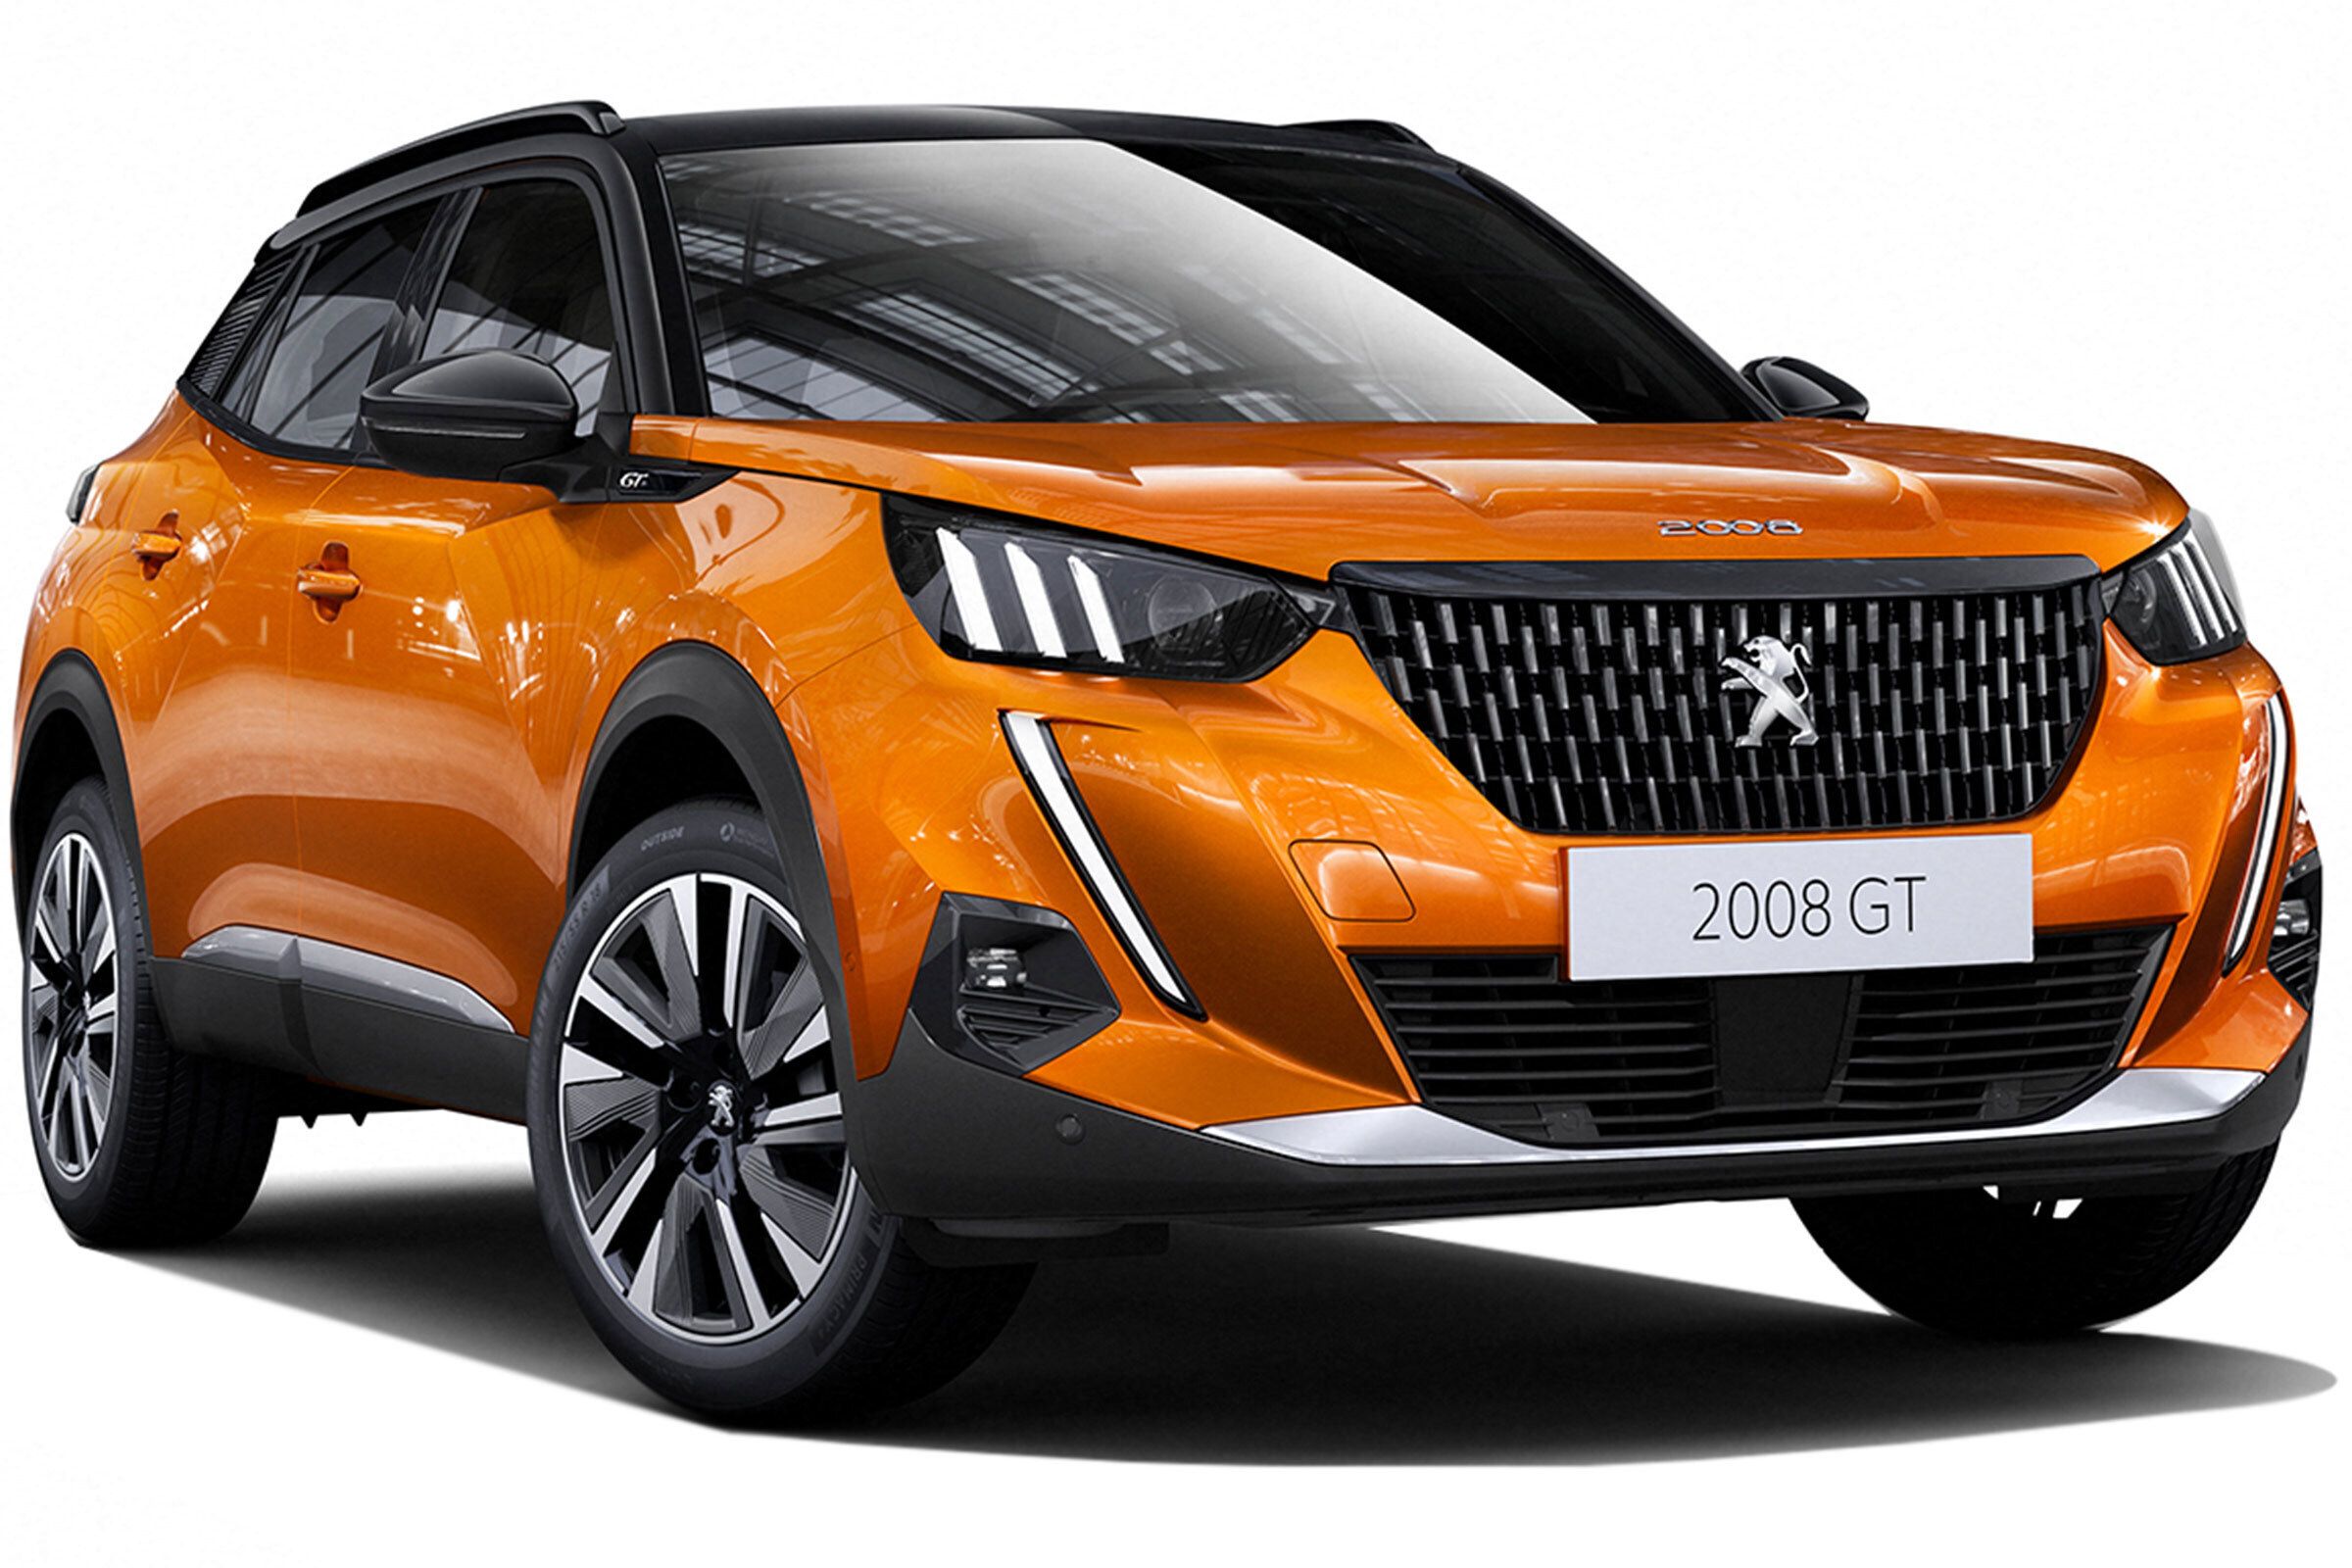
The 2008 is a 5 doors 5 seats SUV with room for 5 people.
How Much Does the Peugeot 2008 Cost?
The 2008 starts at CN¥89,700 Yuan ($12,558 USD) MSRP. Fully equipped, the 2008 will cost you about CN¥128,700 Yuan ($18,018 USD).
Peugeot 2008 Engine and Performance
2008 includes a 1.6LL engine. This delivers 86 Kw (115.33 HP) - 100 Kw (134.10 HP) and 150 Nm (111.00 ft-lb) - 230 Nm (170.20 ft-lb) torque.
Peugeot 2008 Specifications
The 2008 has a curb weight of 1,200 kg (2,700 lbs) - 1,300 kg (2,800 lbs).
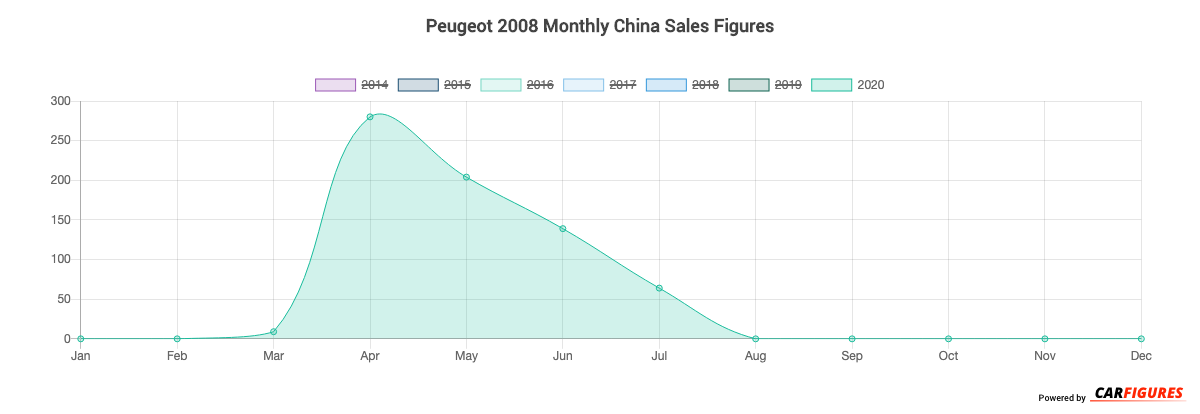
Peugeot 2008 China Sale figures by year, quarter, and month are presented below. Including the most up to date sales data for the Peugeot 2008.
Year | Jan | Feb | Mar | Apr | May | Jun | Jul | Aug | Sep | Oct | Nov | Dec |
|---|---|---|---|---|---|---|---|---|---|---|---|---|
| 2014 | - | - | - | 1,664 | 4,510 | 4,937 | 5,032 | 5,059 | 6,086 | 5,137 | 7,321 | 5,231 |
| 2015 | 8,010 | 5,374 | 1,817 | 5,269 | 4,439 | 4,069 | 1,607 | 2,652 | 3,124 | 4,181 | 4,037 | 4,650 |
| 2016 | 3,743 | 3,204 | 2,986 | 2,673 | 2,687 | 2,123 | 1,761 | 1,743 | 2,475 | 2,801 | 2,217 | 3,418 |
| 2017 | 1,134 | 720 | 1,623 | 737 | 1,056 | 221 | 218 | 740 | 1,071 | 1,884 | 1,681 | 435 |
| 2018 | 765 | 304 | 625 | 421 | 579 | 312 | 52 | 46 | 87 | 127 | 62 | 37 |
| 2019 | 71 | 75 | 659 | 3 | 0 | 0 | -1 | 4 | 0 | 0 | 25 | 1 |
| 2020 | - | - | 9 | 280 | 204 | 139 | 64 | - | - | - | - | - |
| Total | 13,723 | 9,677 | 7,719 | 11,047 | 13,475 | 11,801 | 8,733 | 10,244 | 12,843 | 14,130 | 15,343 | 13,772 |
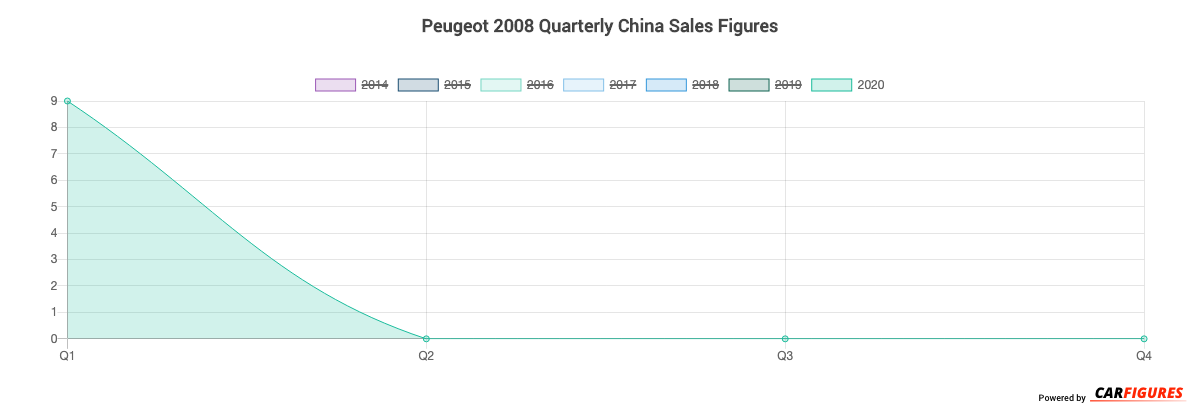
Year | Q1 | Q2 | Q3 | Q4 |
|---|---|---|---|---|
| 2014 | - | 11,111 | 16,177 | 17,689 |
| 2015 | 15,201 | 13,777 | 7,383 | 12,868 |
| 2016 | 9,933 | 7,483 | 5,979 | 8,436 |
| 2017 | 3,477 | 2,014 | 2,029 | 4,000 |
| 2018 | 1,694 | 1,312 | 185 | 226 |
| 2019 | 805 | 3 | 3 | 26 |
| 2020 | 9 | - | - | - |
| Total | 31,119 | 35,700 | 31,756 | 43,245 |
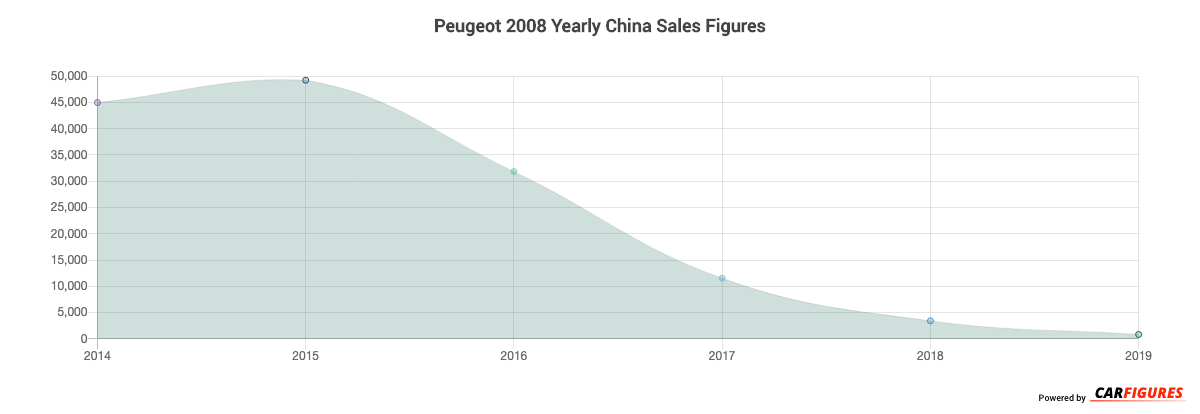
Year | Sales |
|---|---|
| 2020 | 9 |
| 2019 | 837 |
| 2018 | 3,417 |
| 2017 | 11,520 |
| 2016 | 31,831 |
| 2015 | 49,229 |
| 2014 | 44,977 |
| Total | 141,820 |
Download Historic Sales Data


Embedded Code
See more widgetsSources: Manufacturers