Key Stats
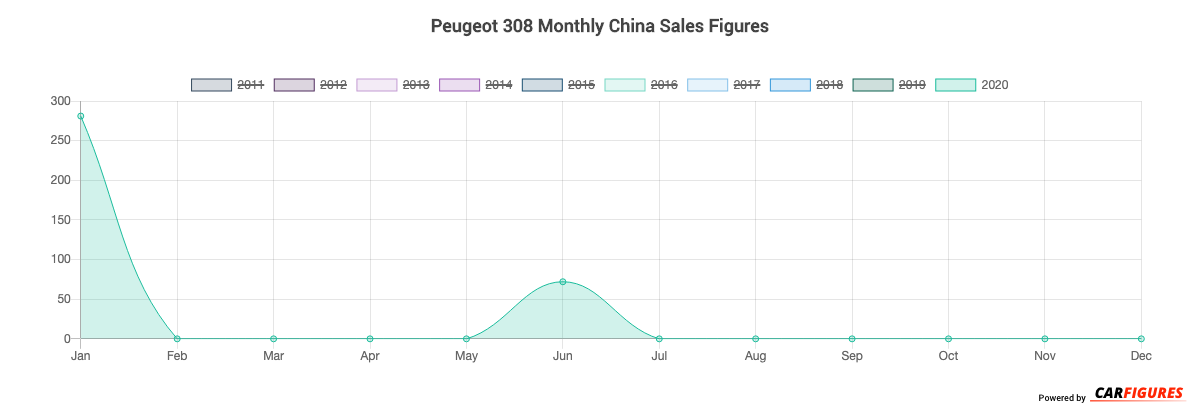
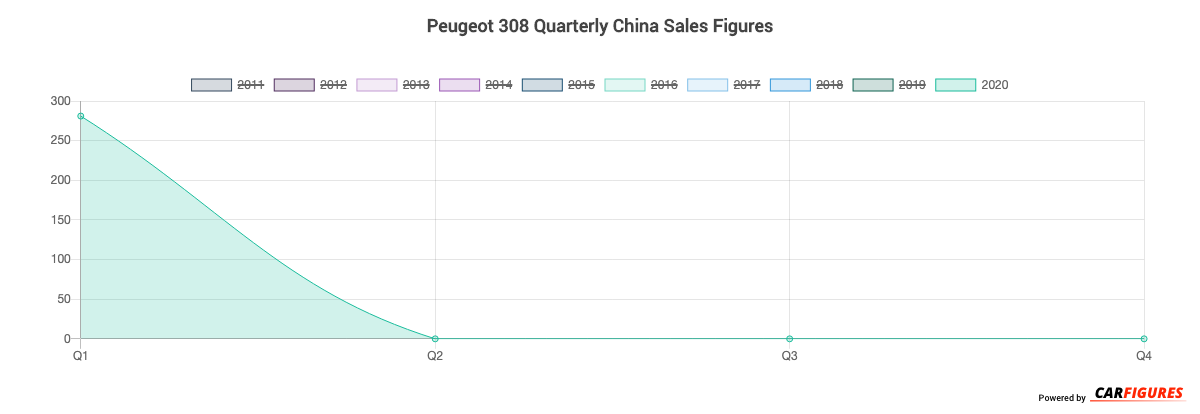
How many 308 did Peugeot sell in 2020?
Peugeot sold 353 308 in 2020. (From Jan - Dec 2020)
How many 308 did Peugeot sell in June 2020?
Peugeot sold 72 308 in June 2020.
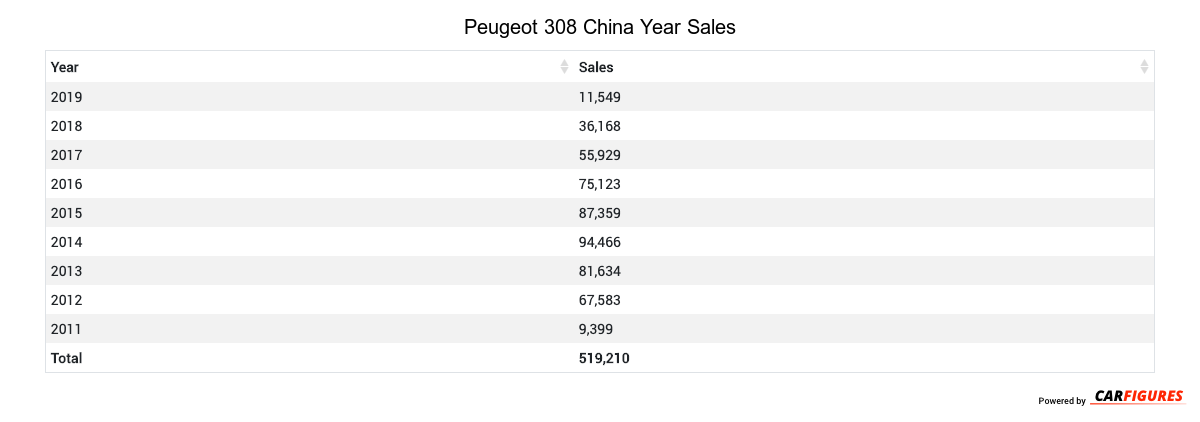
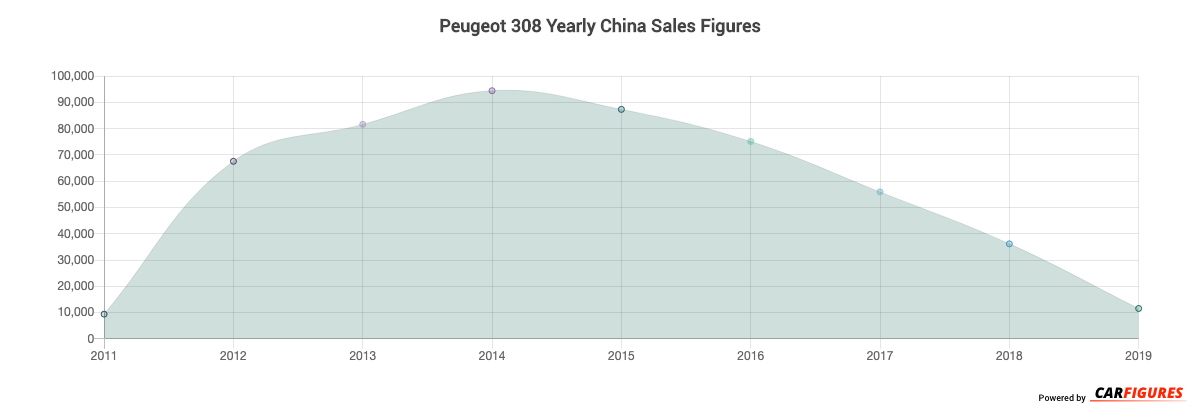
How many 308 did Peugeot sell in 2019?
Peugeot sold 11,549 308 in 2019. In 2018, Peugeot sold 36,168 308. They sold 24,619 more units in year 2018 compared to 2019 with a percent loss of 68.07% YoY.
Overview
The 308 is a 4-door 5-seater sedan with room for 5 people from automaker Peugeot.
How Much Does the Peugeot 308 Cost?
Pricing for the 308 starts at CN¥89,700 Yuan ($12,558 USD) MSRP and goes up to CN¥159,700 Yuan ($22,358 USD) fully equipped.
Peugeot 308 Engine and Performance
308 is powered by a 1.6LL engine that makes 85 Kw (113.99 HP) - 123 Kw (164.95 HP) and 150 Nm (111.00 ft-lb) - 245 Nm (181.30 ft-lb) torque.
Peugeot 308 Specifications
The 308 has a curb weight of 1,300 kg (2,800 lbs) - 1,300 kg (2,900 lbs).
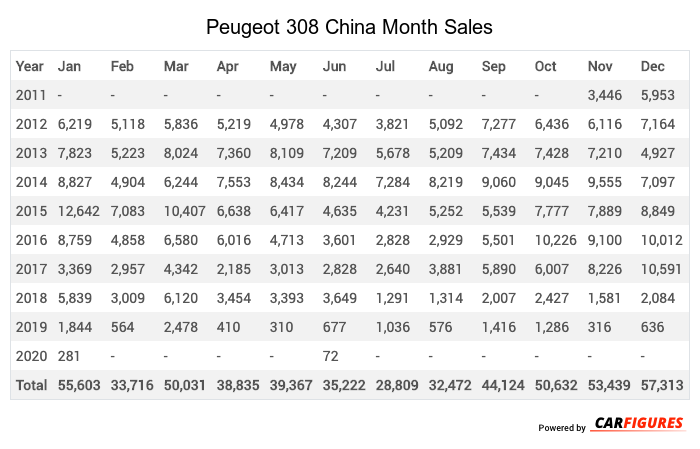
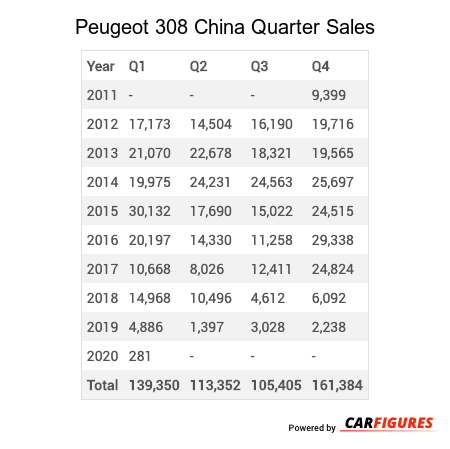
Peugeot 308 China Sale figures by year, quarter, and month are presented below. Including the most up to date sales data for the Peugeot 308.
| Year | Jan | Feb | Mar | Apr | May | Jun | Jul | Aug | Sep | Oct | Nov | Dec |
|---|---|---|---|---|---|---|---|---|---|---|---|---|
| 2011 | - | - | - | - | - | - | - | - | - | - | 3446 | 5953 |
| 2012 | 6219 | 5118 | 5836 | 5219 | 4978 | 4307 | 3821 | 5092 | 7277 | 6436 | 6116 | 7164 |
| 2013 | 7823 | 5223 | 8024 | 7360 | 8109 | 7209 | 5678 | 5209 | 7434 | 7428 | 7210 | 4927 |
| 2014 | 8827 | 4904 | 6244 | 7553 | 8434 | 8244 | 7284 | 8219 | 9060 | 9045 | 9555 | 7097 |
| 2015 | 12642 | 7083 | 10407 | 6638 | 6417 | 4635 | 4231 | 5252 | 5539 | 7777 | 7889 | 8849 |
| 2016 | 8759 | 4858 | 6580 | 6016 | 4713 | 3601 | 2828 | 2929 | 5501 | 10226 | 9100 | 10012 |
| 2017 | 3369 | 2957 | 4342 | 2185 | 3013 | 2828 | 2640 | 3881 | 5890 | 6007 | 8226 | 10591 |
| 2018 | 5839 | 3009 | 6120 | 3454 | 3393 | 3649 | 1291 | 1314 | 2007 | 2427 | 1581 | 2084 |
| 2019 | 1844 | 564 | 2478 | 410 | 310 | 677 | 1036 | 576 | 1416 | 1286 | 316 | 636 |
| 2020 | 281 | - | - | - | - | 72 | - | - | - | - | - | - |
| Total | 55603 | 33716 | 50031 | 38835 | 39367 | 35222 | 28809 | 32472 | 44124 | 50632 | 53439 | 57313 |
| Year | Q1 | Q2 | Q3 | Q4 |
|---|---|---|---|---|
| 2011 | - | - | - | 9399 |
| 2012 | 17173 | 14504 | 16190 | 19716 |
| 2013 | 21070 | 22678 | 18321 | 19565 |
| 2014 | 19975 | 24231 | 24563 | 25697 |
| 2015 | 30132 | 17690 | 15022 | 24515 |
| 2016 | 20197 | 14330 | 11258 | 29338 |
| 2017 | 10668 | 8026 | 12411 | 24824 |
| 2018 | 14968 | 10496 | 4612 | 6092 |
| 2019 | 4886 | 1397 | 3028 | 2238 |
| 2020 | 281 | - | - | - |
| Total | 139350 | 113352 | 105405 | 161384 |
| Year | Sales |
|---|---|
| 2020 | 281 |
| 2019 | 11549 |
| 2018 | 36168 |
| 2017 | 55929 |
| 2016 | 75123 |
| 2015 | 87359 |
| 2014 | 94466 |
| 2013 | 81634 |
| 2012 | 67583 |
| 2011 | 9399 |
| Total | 519491 |
Download Historic Sales Data
Embedded Code
See more widgetsSources: Manufacturers