Key Stats
How many 3008 did Peugeot sell in December 2019?
Peugeot sold 1 3008 in December 2019.
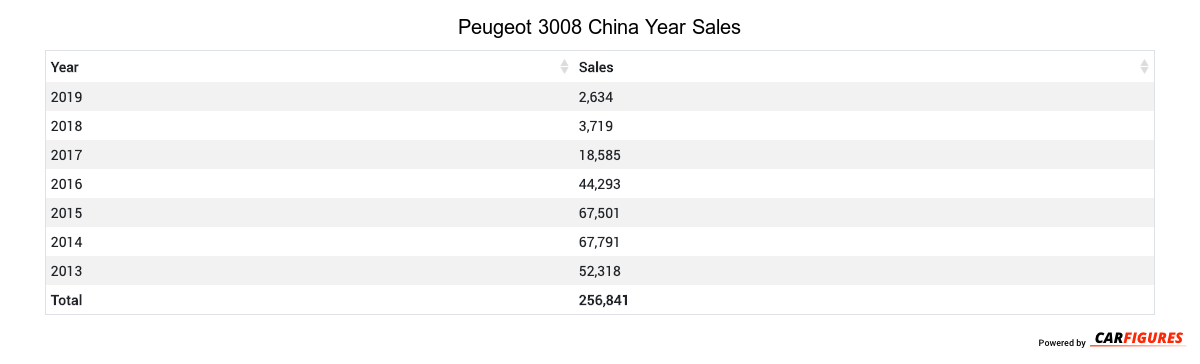
How many 3008 did Peugeot sell in 2019?
Peugeot sold 2,634 3008 in 2019. In 2018, Peugeot sold 3,719 3008. They sold 1,085 more units in year 2018 compared to 2019 with a percent loss of 29.17% YoY.
Overview
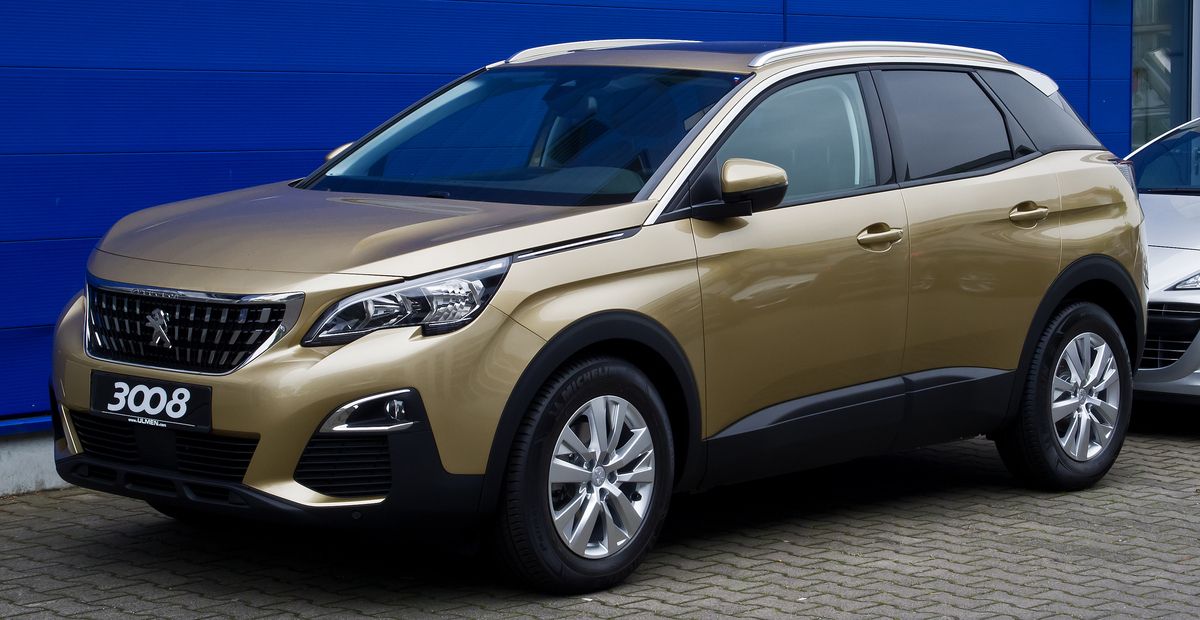
The 3008 is a 5 doors 5 seats SUV with room for 5 people from automaker Peugeot.
How Much Does the Peugeot 3008 Cost?
Pricing for the 3008 starts at CN¥139,700 Yuan ($19,558 USD) MSRP and goes up to CN¥149,700 Yuan ($20,958 USD) fully equipped.
Peugeot 3008 Engine and Performance
The 3008 includes a 1.6TL that delivers 123 Kw (164.95 HP) - 123 Kw (164.95 HP) and 245 Nm (181.30 ft-lb) - 245 Nm (181.30 ft-lb) torque.
Peugeot 3008 Specifications
The 3008 has a curb weight of 1,500 kg (3,400 lbs) - 1,500 kg (3,400 lbs).
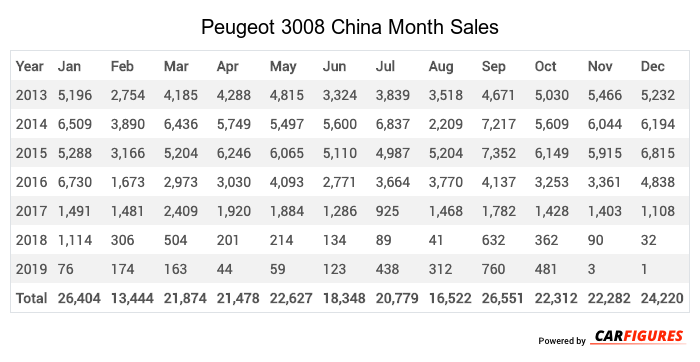
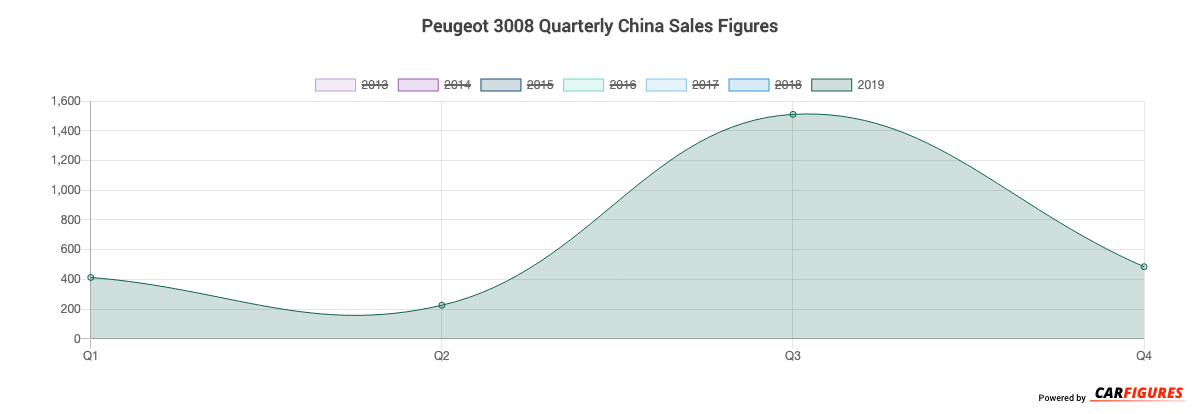
Peugeot 3008 China Sale figures by year, quarter, and month are presented below. Including the most up to date sales data for the Peugeot 3008.
Year | Jan | Feb | Mar | Apr | May | Jun | Jul | Aug | Sep | Oct | Nov | Dec |
|---|---|---|---|---|---|---|---|---|---|---|---|---|
| 2013 | 5,196 | 2,754 | 4,185 | 4,288 | 4,815 | 3,324 | 3,839 | 3,518 | 4,671 | 5,030 | 5,466 | 5,232 |
| 2014 | 6,509 | 3,890 | 6,436 | 5,749 | 5,497 | 5,600 | 6,837 | 2,209 | 7,217 | 5,609 | 6,044 | 6,194 |
| 2015 | 5,288 | 3,166 | 5,204 | 6,246 | 6,065 | 5,110 | 4,987 | 5,204 | 7,352 | 6,149 | 5,915 | 6,815 |
| 2016 | 6,730 | 1,673 | 2,973 | 3,030 | 4,093 | 2,771 | 3,664 | 3,770 | 4,137 | 3,253 | 3,361 | 4,838 |
| 2017 | 1,491 | 1,481 | 2,409 | 1,920 | 1,884 | 1,286 | 925 | 1,468 | 1,782 | 1,428 | 1,403 | 1,108 |
| 2018 | 1,114 | 306 | 504 | 201 | 214 | 134 | 89 | 41 | 632 | 362 | 90 | 32 |
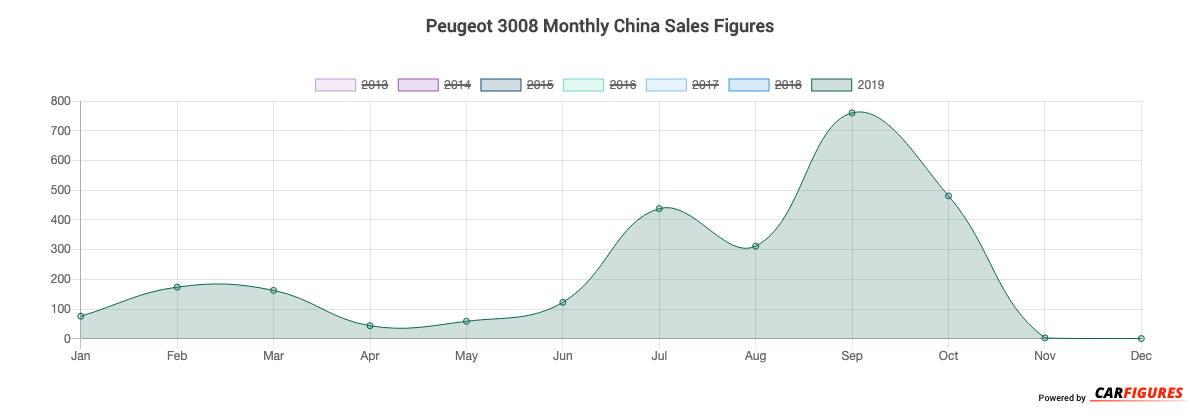
| 2019 | 76 | 174 | 163 | 44 | 59 | 123 | 438 | 312 | 760 | 481 | 3 | 1 |
| Total | 26,404 | 13,444 | 21,874 | 21,478 | 22,627 | 18,348 | 20,779 | 16,522 | 26,551 | 22,312 | 22,282 | 24,220 |
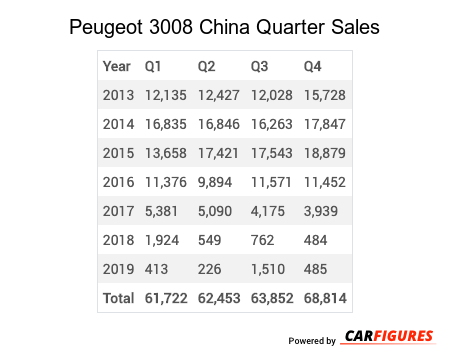
Year | Q1 | Q2 | Q3 | Q4 |
|---|---|---|---|---|
| 2013 | 12,135 | 12,427 | 12,028 | 15,728 |
| 2014 | 16,835 | 16,846 | 16,263 | 17,847 |
| 2015 | 13,658 | 17,421 | 17,543 | 18,879 |
| 2016 | 11,376 | 9,894 | 11,571 | 11,452 |
| 2017 | 5,381 | 5,090 | 4,175 | 3,939 |
| 2018 | 1,924 | 549 | 762 | 484 |
| 2019 | 413 | 226 | 1,510 | 485 |
| Total | 61,722 | 62,453 | 63,852 | 68,814 |
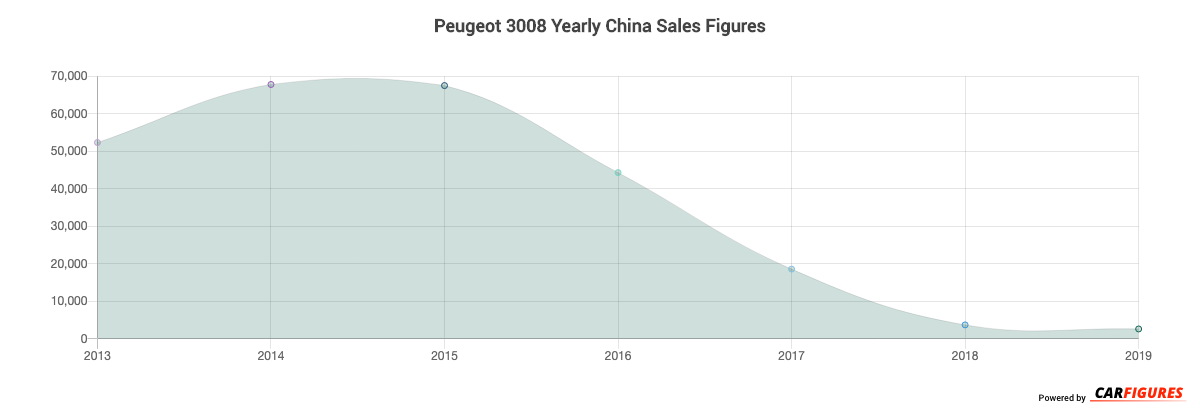
Year | Sales |
|---|---|
| 2019 | 2,634 |
| 2018 | 3,719 |
| 2017 | 18,585 |
| 2016 | 44,293 |
| 2015 | 67,501 |
| 2014 | 67,791 |
| 2013 | 52,318 |
| Total | 256,841 |
Download Historic Sales Data
Embedded Code
See more widgetsSources: Manufacturers