Key Stats
How many RVR/Outlander Sport did Mitsubishi sell in Q4 2021?
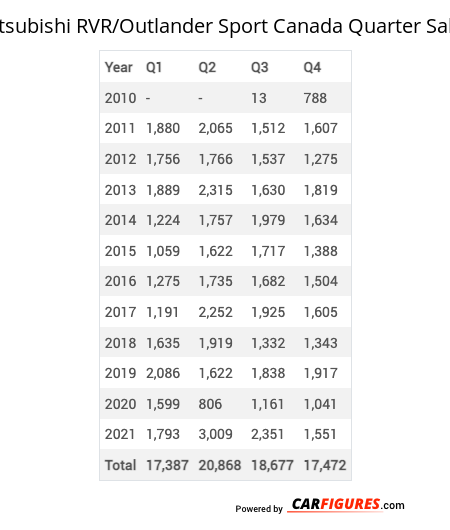
Mitsubishi sold 1,551 RVR/Outlander Sport in Q4 2021.
How many RVR/Outlander Sport did Mitsubishi sell in 2021?
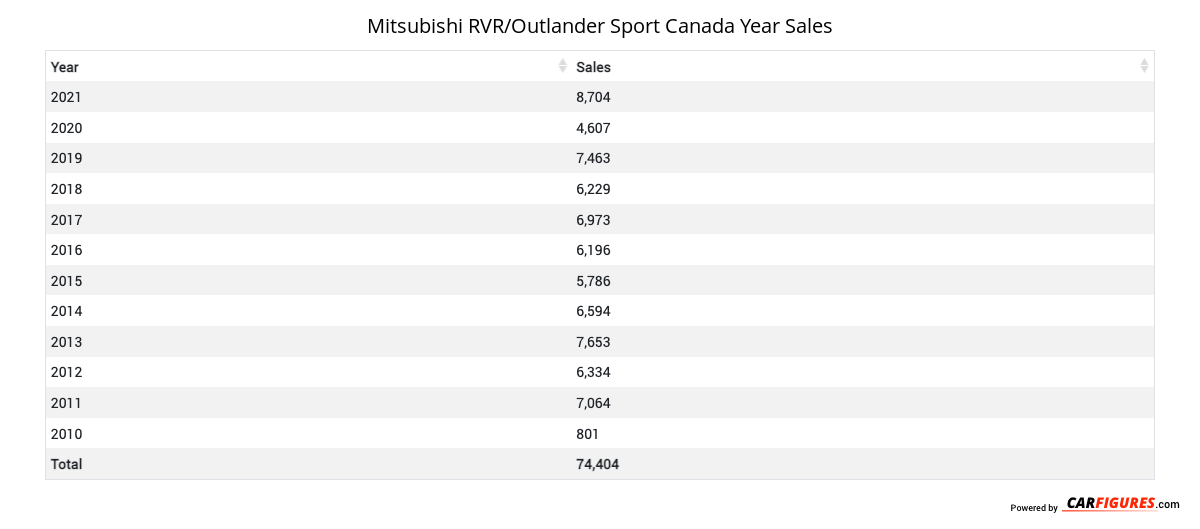
Mitsubishi sold 8,704 RVR/Outlander Sport in 2021. In 2020, Mitsubishi sold 4,607 RVR/Outlander Sport. They sold 4,097 more units in 2021 compared to 2020 with a percent gain of 88.93% YoY.
Overview
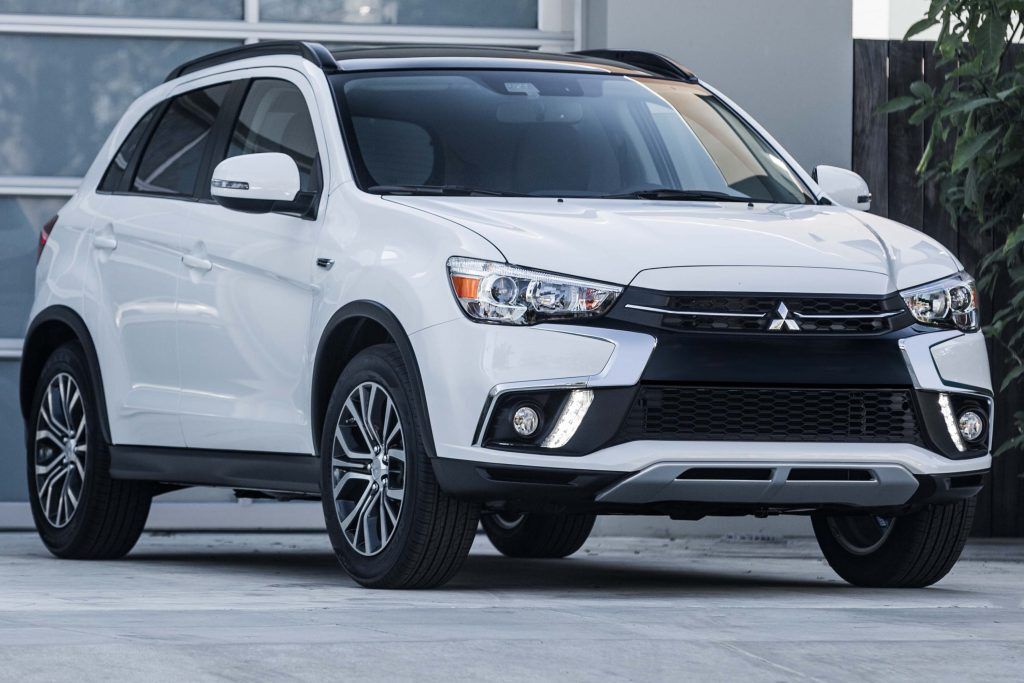
The 2022 Mitsubishi RVR is a vehicle from automaker Mitsubishi.
How Much Does the 2022 Mitsubishi RVR Cost?
Pricing for the 2022 Mitsubishi RVR starts at $23,828 MSRP and goes up to $35,118 fully loaded.
Mitsubishi RVR Engine, Transmission, and Performance Numbers
Mitsubishi RVR is powered by a front-wheel-drive powertrain that makes 148 horsepower and 145 ft-lb torque.
List of Mitsubishi RVR Competitors
Some of Mitsubishi RVR competitors include the Kia Seltos, Kia Sportage, Kia Sorento, Kia Telluride, Chevrolet TrailBlazer, Ford EcoSport, Honda HR-V, Mazda CX-30, Subaru Crosstrek, Toyota Corolla Cross, Chevrolet Equinox and Chevrolet Trax.
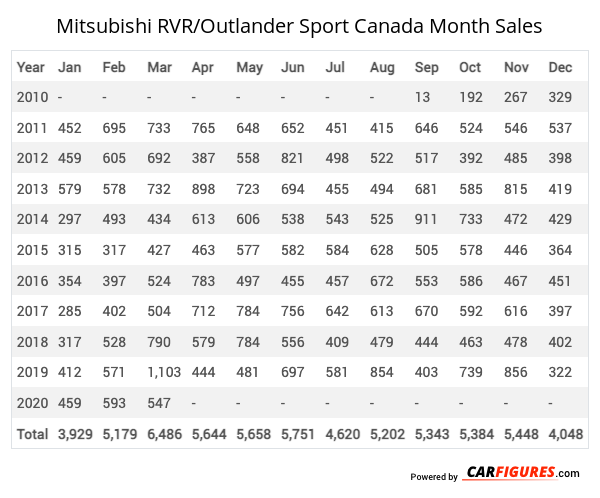
Mitsubishi RVR/Outlander Sport Canadian Sale figures by year, quarter, and month are presented below. Including the most up to date sales data for the Mitsubishi RVR/Outlander Sport.
Year | Jan | Feb | Mar | Apr | May | Jun | Jul | Aug | Sep | Oct | Nov | Dec |
|---|---|---|---|---|---|---|---|---|---|---|---|---|
| 2010 | - | - | - | - | - | - | - | - | 13 | 192 | 267 | 329 |
| 2011 | 452 | 695 | 733 | 765 | 648 | 652 | 451 | 415 | 646 | 524 | 546 | 537 |
| 2012 | 459 | 605 | 692 | 387 | 558 | 821 | 498 | 522 | 517 | 392 | 485 | 398 |
| 2013 | 579 | 578 | 732 | 898 | 723 | 694 | 455 | 494 | 681 | 585 | 815 | 419 |
| 2014 | 297 | 493 | 434 | 613 | 606 | 538 | 543 | 525 | 911 | 733 | 472 | 429 |
| 2015 | 315 | 317 | 427 | 463 | 577 | 582 | 584 | 628 | 505 | 578 | 446 | 364 |
| 2016 | 354 | 397 | 524 | 783 | 497 | 455 | 457 | 672 | 553 | 586 | 467 | 451 |
| 2017 | 285 | 402 | 504 | 712 | 784 | 756 | 642 | 613 | 670 | 592 | 616 | 397 |
| 2018 | 317 | 528 | 790 | 579 | 784 | 556 | 409 | 479 | 444 | 463 | 478 | 402 |
| 2019 | 412 | 571 | 1,103 | 444 | 481 | 697 | 581 | 854 | 403 | 739 | 856 | 322 |
| 2020 | 459 | 593 | 547 | - | - | - | - | - | - | - | - | - |
| Total | 3,929 | 5,179 | 6,486 | 5,644 | 5,658 | 5,751 | 4,620 | 5,202 | 5,343 | 5,384 | 5,448 | 4,048 |
Year | Q1 | Q2 | Q3 | Q4 |
|---|---|---|---|---|
| 2010 | - | - | 13 | 788 |
| 2011 | 1,880 | 2,065 | 1,512 | 1,607 |
| 2012 | 1,756 | 1,766 | 1,537 | 1,275 |
| 2013 | 1,889 | 2,315 | 1,630 | 1,819 |
| 2014 | 1,224 | 1,757 | 1,979 | 1,634 |
| 2015 | 1,059 | 1,622 | 1,717 | 1,388 |
| 2016 | 1,275 | 1,735 | 1,682 | 1,504 |
| 2017 | 1,191 | 2,252 | 1,925 | 1,605 |
| 2018 | 1,635 | 1,919 | 1,332 | 1,343 |
| 2019 | 2,086 | 1,622 | 1,838 | 1,917 |
| 2020 | 1,599 | 806 | 1,161 | 1,041 |
| 2021 | 1,793 | 3,009 | 2,351 | 1,551 |
| Total | 17,387 | 20,868 | 18,677 | 17,472 |
Year | Sales |
|---|---|
| 2021 | 8,704 |
| 2020 | 4,607 |
| 2019 | 7,463 |
| 2018 | 6,229 |
| 2017 | 6,973 |
| 2016 | 6,196 |
| 2015 | 5,786 |
| 2014 | 6,594 |
| 2013 | 7,653 |
| 2012 | 6,334 |
| 2011 | 7,064 |
| 2010 | 801 |
| Total | 74,404 |
Download Historic Sales Data
Looking for more data/visualizations? Send us an email at contact@carfigures.com for customized data aggregates and visualizations.Embedded Code
See more widgetsSources: Manufacturers

