
Key Stats
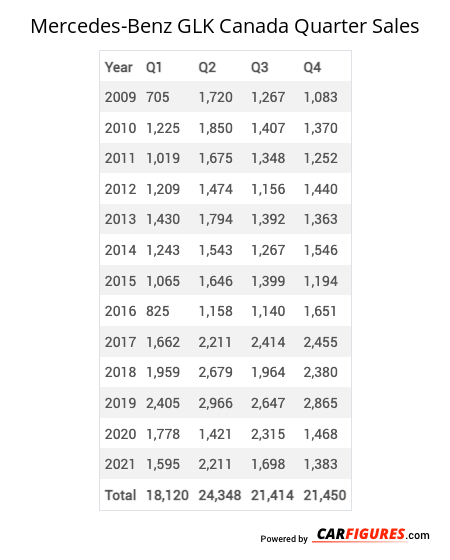
How many GLK did Mercedes-Benz sell in Q4 2021?
Mercedes-Benz sold 1,383 GLK in Q4 2021.
How many GLK did Mercedes-Benz sell in 2021?
Mercedes-Benz sold 6,887 GLK in 2021. In 2020, Mercedes-Benz sold 6,982 GLK. They sold 95 more units in year 2020 compared to 2021 with a percent loss of 1.36% YoY.
Overview
The 2015 Mercedes-Benz GLK-Class weighs 1925 kg with room to seat up to 5 people.
How Much Does the 2015 Mercedes-Benz GLK-Class Cost?
The 2015 Mercedes-Benz GLK-Class starts at $43,900 MSRP. Fully loaded, the Mercedes-Benz GLK-Class will cost you about $46,000.
Mercedes-Benz GLK-Class Engine, Transmission, and Performance Numbers
Mercedes-Benz GLK-Class delivers 200 horsepower with 273 ft-lb torque delivered through a all-wheel-drive drivetrain.
List of Mercedes-Benz GLK-Class Competitors
Some of Mercedes-Benz GLK-Class competitors include the Volvo XC60, Acura RDX, Audi Q5, Infiniti QX60, BMW X3, Lincoln MKX and Land Rover Range Rover Evoque.
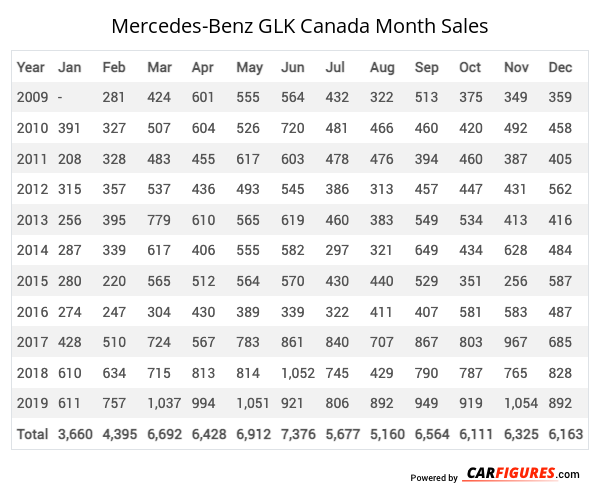
Mercedes-Benz GLK Canadian Sale figures by year, quarter, and month are presented below. Including the most up to date sales data for the Mercedes-Benz GLK.
Year | Jan | Feb | Mar | Apr | May | Jun | Jul | Aug | Sep | Oct | Nov | Dec |
|---|---|---|---|---|---|---|---|---|---|---|---|---|
| 2009 | - | 281 | 424 | 601 | 555 | 564 | 432 | 322 | 513 | 375 | 349 | 359 |
| 2010 | 391 | 327 | 507 | 604 | 526 | 720 | 481 | 466 | 460 | 420 | 492 | 458 |
| 2011 | 208 | 328 | 483 | 455 | 617 | 603 | 478 | 476 | 394 | 460 | 387 | 405 |
| 2012 | 315 | 357 | 537 | 436 | 493 | 545 | 386 | 313 | 457 | 447 | 431 | 562 |
| 2013 | 256 | 395 | 779 | 610 | 565 | 619 | 460 | 383 | 549 | 534 | 413 | 416 |
| 2014 | 287 | 339 | 617 | 406 | 555 | 582 | 297 | 321 | 649 | 434 | 628 | 484 |
| 2015 | 280 | 220 | 565 | 512 | 564 | 570 | 430 | 440 | 529 | 351 | 256 | 587 |
| 2016 | 274 | 247 | 304 | 430 | 389 | 339 | 322 | 411 | 407 | 581 | 583 | 487 |
| 2017 | 428 | 510 | 724 | 567 | 783 | 861 | 840 | 707 | 867 | 803 | 967 | 685 |
| 2018 | 610 | 634 | 715 | 813 | 814 | 1,052 | 745 | 429 | 790 | 787 | 765 | 828 |
| 2019 | 611 | 757 | 1,037 | 994 | 1,051 | 921 | 806 | 892 | 949 | 919 | 1,054 | 892 |
| Total | 3,660 | 4,395 | 6,692 | 6,428 | 6,912 | 7,376 | 5,677 | 5,160 | 6,564 | 6,111 | 6,325 | 6,163 |
Year | Q1 | Q2 | Q3 | Q4 |
|---|---|---|---|---|
| 2009 | 705 | 1,720 | 1,267 | 1,083 |
| 2010 | 1,225 | 1,850 | 1,407 | 1,370 |
| 2011 | 1,019 | 1,675 | 1,348 | 1,252 |
| 2012 | 1,209 | 1,474 | 1,156 | 1,440 |
| 2013 | 1,430 | 1,794 | 1,392 | 1,363 |
| 2014 | 1,243 | 1,543 | 1,267 | 1,546 |
| 2015 | 1,065 | 1,646 | 1,399 | 1,194 |
| 2016 | 825 | 1,158 | 1,140 | 1,651 |
| 2017 | 1,662 | 2,211 | 2,414 | 2,455 |
| 2018 | 1,959 | 2,679 | 1,964 | 2,380 |
| 2019 | 2,405 | 2,966 | 2,647 | 2,865 |
| 2020 | 1,778 | 1,421 | 2,315 | 1,468 |
| 2021 | 1,595 | 2,211 | 1,698 | 1,383 |
| Total | 18,120 | 24,348 | 21,414 | 21,450 |
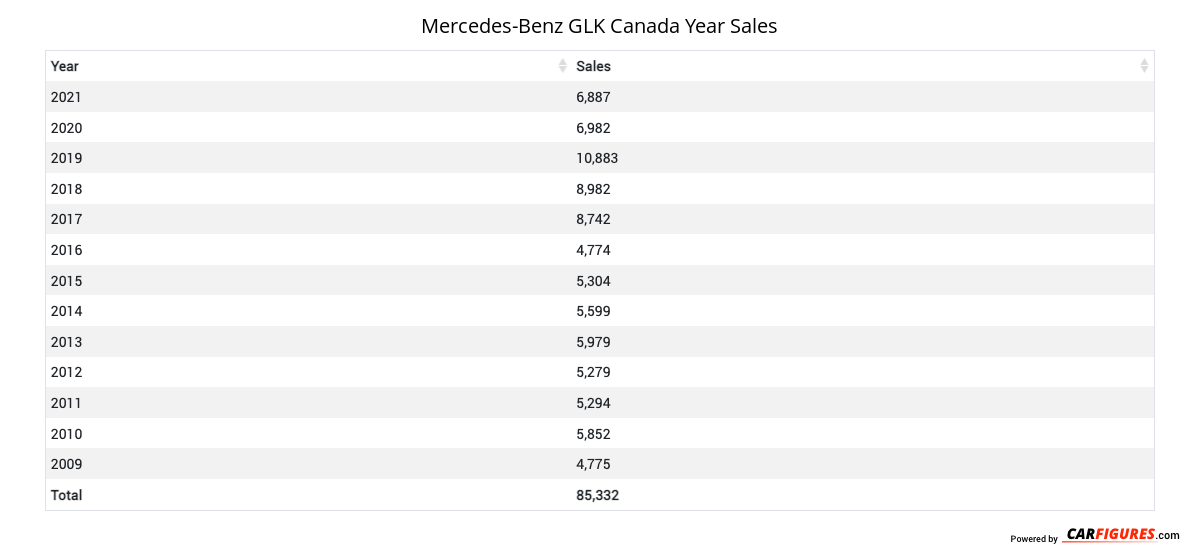
Year | Sales |
|---|---|
| 2021 | 6,887 |
| 2020 | 6,982 |
| 2019 | 10,883 |
| 2018 | 8,982 |
| 2017 | 8,742 |
| 2016 | 4,774 |
| 2015 | 5,304 |
| 2014 | 5,599 |
| 2013 | 5,979 |
| 2012 | 5,279 |
| 2011 | 5,294 |
| 2010 | 5,852 |
| 2009 | 4,775 |
| Total | 85,332 |
Download Historic Sales Data
Embedded Code
See more widgetsSources: Manufacturers