Key Stats
How many X3 did BMW sell in Q4 2021?
BMW sold 2,440 X3 in Q4 2021.
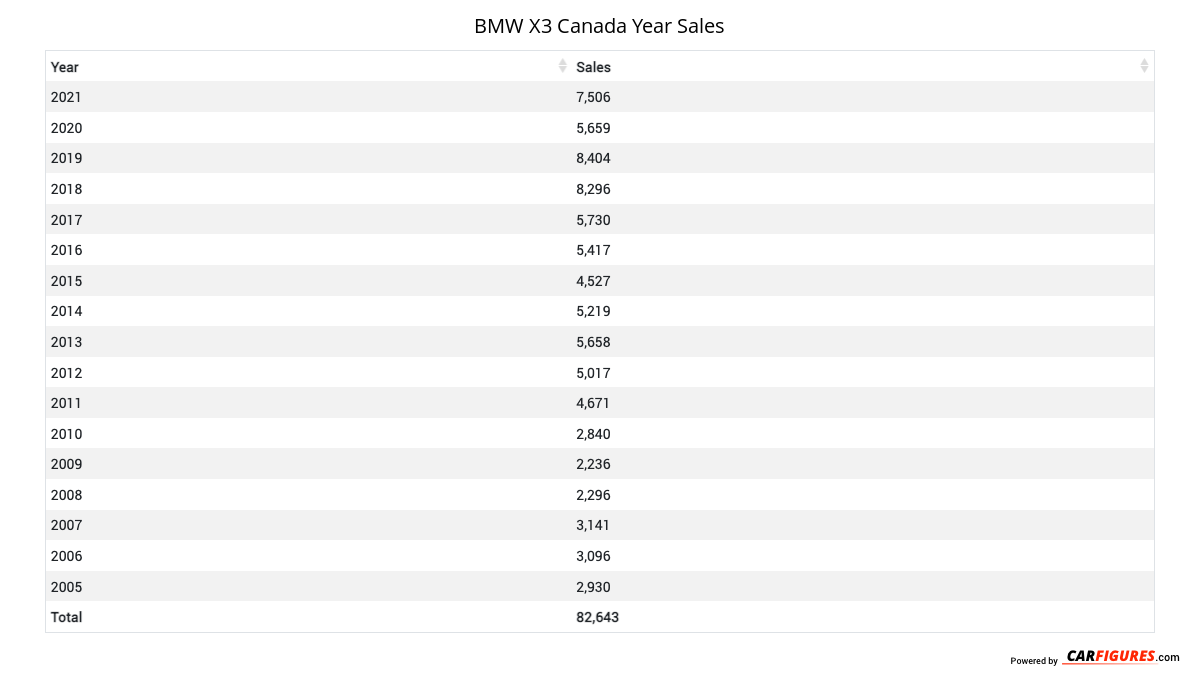
How many X3 did BMW sell in 2021?
BMW sold 7,506 X3 in 2021. In 2020, BMW sold 5,659 X3. They sold 1,847 more units in 2021 compared to 2020 with a percent gain of 32.64% YoY.
Overview
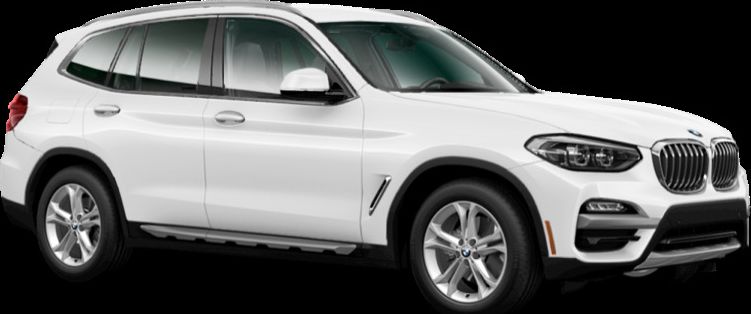
The 2022 BMW X3 is a vehicle from automaker BMW.
How Much Does the 2022 BMW X3 Cost?
The 2022 BMW X3 starts at $52,990 MSRP. Fully loaded, the BMW X3 will cost you about $68,000.
BMW X3 Engine, Transmission, and Performance Numbers
BMW X3 is powered by a all-wheel-drive powertrain that makes 248 horsepower and 258 ft-lb torque.
List of BMW X3 Competitors
Some of BMW X3 competitors include the Audi Q5, Genesis GV70, Genesis GV80, Land Rover Discovery Sport, Land Rover Range Rover Evoque, Lexus RX, Audi Q3 and Audi Q7.
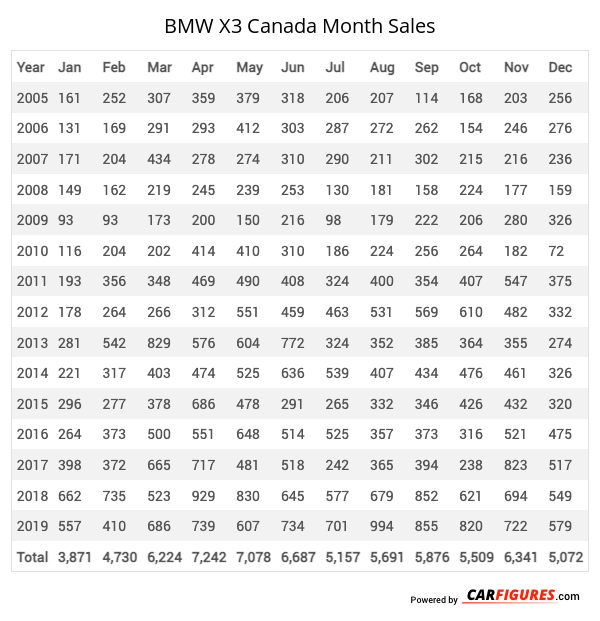
BMW X3 Canadian Sale figures by year, quarter, and month are presented below. Including the most up to date sales data for the BMW X3. See how the BMW X3 stacks up the other models in the Crossover/SUVS, Premium Compact Crossover/SUVs segments.
Year | Jan | Feb | Mar | Apr | May | Jun | Jul | Aug | Sep | Oct | Nov | Dec |
|---|---|---|---|---|---|---|---|---|---|---|---|---|
| 2005 | 161 | 252 | 307 | 359 | 379 | 318 | 206 | 207 | 114 | 168 | 203 | 256 |
| 2006 | 131 | 169 | 291 | 293 | 412 | 303 | 287 | 272 | 262 | 154 | 246 | 276 |
| 2007 | 171 | 204 | 434 | 278 | 274 | 310 | 290 | 211 | 302 | 215 | 216 | 236 |
| 2008 | 149 | 162 | 219 | 245 | 239 | 253 | 130 | 181 | 158 | 224 | 177 | 159 |
| 2009 | 93 | 93 | 173 | 200 | 150 | 216 | 98 | 179 | 222 | 206 | 280 | 326 |
| 2010 | 116 | 204 | 202 | 414 | 410 | 310 | 186 | 224 | 256 | 264 | 182 | 72 |
| 2011 | 193 | 356 | 348 | 469 | 490 | 408 | 324 | 400 | 354 | 407 | 547 | 375 |
| 2012 | 178 | 264 | 266 | 312 | 551 | 459 | 463 | 531 | 569 | 610 | 482 | 332 |
| 2013 | 281 | 542 | 829 | 576 | 604 | 772 | 324 | 352 | 385 | 364 | 355 | 274 |
| 2014 | 221 | 317 | 403 | 474 | 525 | 636 | 539 | 407 | 434 | 476 | 461 | 326 |
| 2015 | 296 | 277 | 378 | 686 | 478 | 291 | 265 | 332 | 346 | 426 | 432 | 320 |
| 2016 | 264 | 373 | 500 | 551 | 648 | 514 | 525 | 357 | 373 | 316 | 521 | 475 |
| 2017 | 398 | 372 | 665 | 717 | 481 | 518 | 242 | 365 | 394 | 238 | 823 | 517 |
| 2018 | 662 | 735 | 523 | 929 | 830 | 645 | 577 | 679 | 852 | 621 | 694 | 549 |
| 2019 | 557 | 410 | 686 | 739 | 607 | 734 | 701 | 994 | 855 | 820 | 722 | 579 |
| Total | 3,871 | 4,730 | 6,224 | 7,242 | 7,078 | 6,687 | 5,157 | 5,691 | 5,876 | 5,509 | 6,341 | 5,072 |
Year | Q1 | Q2 | Q3 | Q4 |
|---|---|---|---|---|
| 2005 | 720 | 1,056 | 527 | 627 |
| 2006 | 591 | 1,008 | 821 | 676 |
| 2007 | 809 | 862 | 803 | 667 |
| 2008 | 530 | 737 | 469 | 560 |
| 2009 | 359 | 566 | 499 | 812 |
| 2010 | 522 | 1,134 | 666 | 518 |
| 2011 | 897 | 1,367 | 1,078 | 1,329 |
| 2012 | 708 | 1,322 | 1,563 | 1,424 |
| 2013 | 1,652 | 1,952 | 1,061 | 993 |
| 2014 | 941 | 1,635 | 1,380 | 1,263 |
| 2015 | 951 | 1,455 | 943 | 1,178 |
| 2016 | 1,137 | 1,713 | 1,255 | 1,312 |
| 2017 | 1,435 | 1,716 | 1,001 | 1,578 |
| 2018 | 1,920 | 2,404 | 2,108 | 1,864 |
| 2019 | 1,653 | 2,080 | 2,550 | 2,121 |
| 2020 | 1,185 | 1,537 | 1,523 | 1,414 |
| 2021 | 1,264 | 1,858 | 1,944 | 2,440 |
| Total | 17,274 | 24,402 | 20,191 | 20,776 |
Year | Sales |
|---|---|
| 2021 | 7,506 |
| 2020 | 5,659 |
| 2019 | 8,404 |
| 2018 | 8,296 |
| 2017 | 5,730 |
| 2016 | 5,417 |
| 2015 | 4,527 |
| 2014 | 5,219 |
| 2013 | 5,658 |
| 2012 | 5,017 |
| 2011 | 4,671 |
| 2010 | 2,840 |
| 2009 | 2,236 |
| 2008 | 2,296 |
| 2007 | 3,141 |
| 2006 | 3,096 |
| 2005 | 2,930 |
| Total | 82,643 |
Download Historic Sales Data

Embedded Code
See more widgetsSources: Manufacturers