Key Stats
How many RDX did Acura sell in 2022?
Acura sold 1,126 RDX in 2022. (From Jan - Feb 2022)
How many RDX did Acura sell in February 2022?
Acura sold 548 RDX in February 2022.
How many RDX did Acura sell in 2021?
Acura sold 7,976 RDX in 2021. In 2020, Acura sold 7,563 RDX. They sold 413 more units in 2021 compared to 2020 with a percent gain of 5.46% YoY.
Overview
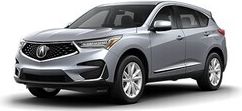
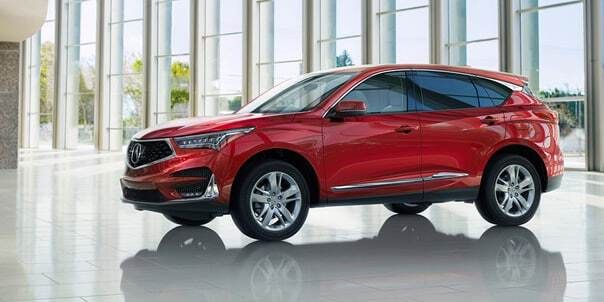
The 2022 Acura RDX is a vehicle from automaker Acura.
How Much Does the 2022 Acura RDX Cost?
Pricing for the 2022 Acura RDX starts at $45,800 MSRP and goes up to $61,500 fully loaded.
Acura RDX Engine, Transmission, and Performance Numbers
Acura RDX delivers 272 horsepower with 280 ft-lb torque delivered through a all-wheel-drive drivetrain.
List of Acura RDX Competitors
Some of Acura RDX competitors include the Infiniti QX50, Infiniti QX55, Infiniti QX60, Infiniti QX80, Lexus NX, Acura MDX, Lexus RX, Infiniti QX50, Buick Enclave, Genesis GV70 and Volkswagen Atlas.
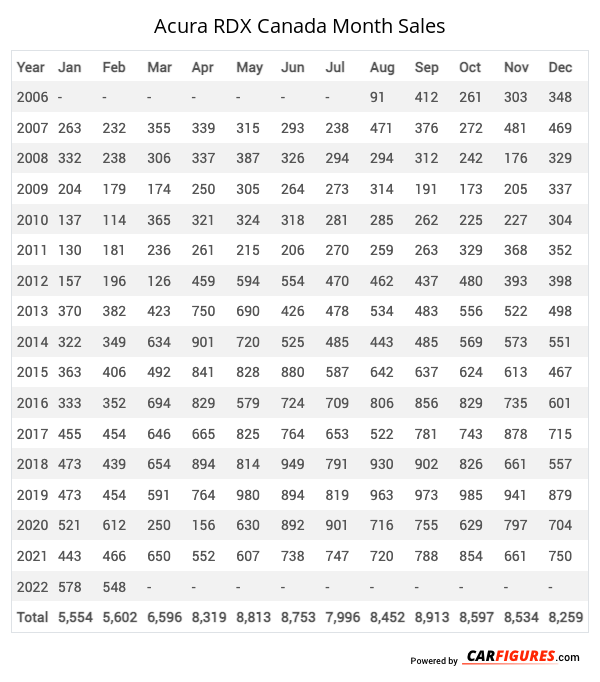
Acura RDX Canadian Sale figures by year, quarter, and month are presented below. Including the most up to date sales data for the Acura RDX. See how the Acura RDX stacks up the other models in the Crossover/SUVS, Premium Compact Crossover/SUVs segments.
Year | Jan | Feb | Mar | Apr | May | Jun | Jul | Aug | Sep | Oct | Nov | Dec |
|---|---|---|---|---|---|---|---|---|---|---|---|---|
| 2006 | - | - | - | - | - | - | - | 91 | 412 | 261 | 303 | 348 |
| 2007 | 263 | 232 | 355 | 339 | 315 | 293 | 238 | 471 | 376 | 272 | 481 | 469 |
| 2008 | 332 | 238 | 306 | 337 | 387 | 326 | 294 | 294 | 312 | 242 | 176 | 329 |
| 2009 | 204 | 179 | 174 | 250 | 305 | 264 | 273 | 314 | 191 | 173 | 205 | 337 |
| 2010 | 137 | 114 | 365 | 321 | 324 | 318 | 281 | 285 | 262 | 225 | 227 | 304 |
| 2011 | 130 | 181 | 236 | 261 | 215 | 206 | 270 | 259 | 263 | 329 | 368 | 352 |
| 2012 | 157 | 196 | 126 | 459 | 594 | 554 | 470 | 462 | 437 | 480 | 393 | 398 |
| 2013 | 370 | 382 | 423 | 750 | 690 | 426 | 478 | 534 | 483 | 556 | 522 | 498 |
| 2014 | 322 | 349 | 634 | 901 | 720 | 525 | 485 | 443 | 485 | 569 | 573 | 551 |
| 2015 | 363 | 406 | 492 | 841 | 828 | 880 | 587 | 642 | 637 | 624 | 613 | 467 |
| 2016 | 333 | 352 | 694 | 829 | 579 | 724 | 709 | 806 | 856 | 829 | 735 | 601 |
| 2017 | 455 | 454 | 646 | 665 | 825 | 764 | 653 | 522 | 781 | 743 | 878 | 715 |
| 2018 | 473 | 439 | 654 | 894 | 814 | 949 | 791 | 930 | 902 | 826 | 661 | 557 |
| 2019 | 473 | 454 | 591 | 764 | 980 | 894 | 819 | 963 | 973 | 985 | 941 | 879 |
| 2020 | 521 | 612 | 250 | 156 | 630 | 892 | 901 | 716 | 755 | 629 | 797 | 704 |
| 2021 | 443 | 466 | 650 | 552 | 607 | 738 | 747 | 720 | 788 | 854 | 661 | 750 |
| 2022 | 578 | 548 | - | - | - | - | - | - | - | - | - | - |
| Total | 5,554 | 5,602 | 6,596 | 8,319 | 8,813 | 8,753 | 7,996 | 8,452 | 8,913 | 8,597 | 8,534 | 8,259 |
Year | Q1 | Q2 | Q3 | Q4 |
|---|---|---|---|---|
| 2006 | - | - | 503 | 912 |
| 2007 | 850 | 947 | 1,085 | 1,222 |
| 2008 | 876 | 1,050 | 900 | 747 |
| 2009 | 557 | 819 | 778 | 715 |
| 2010 | 616 | 963 | 828 | 756 |
| 2011 | 547 | 682 | 792 | 1,049 |
| 2012 | 479 | 1,607 | 1,369 | 1,271 |
| 2013 | 1,175 | 1,866 | 1,495 | 1,576 |
| 2014 | 1,305 | 2,146 | 1,413 | 1,693 |
| 2015 | 1,261 | 2,549 | 1,866 | 1,704 |
| 2016 | 1,379 | 2,132 | 2,371 | 2,165 |
| 2017 | 1,555 | 2,254 | 1,956 | 2,336 |
| 2018 | 1,566 | 2,657 | 2,623 | 2,044 |
| 2019 | 1,518 | 2,638 | 2,755 | 2,805 |
| 2020 | 1,383 | 1,678 | 2,372 | 2,130 |
| 2021 | 1,559 | 1,897 | 2,255 | 2,265 |
| Total | 16,626 | 25,885 | 25,361 | 25,390 |
Year | Sales |
|---|---|
| 2021 | 7,976 |
| 2020 | 7,563 |
| 2019 | 9,716 |
| 2018 | 8,890 |
| 2017 | 8,101 |
| 2016 | 8,047 |
| 2015 | 7,380 |
| 2014 | 6,557 |
| 2013 | 6,112 |
| 2012 | 4,726 |
| 2011 | 3,070 |
| 2010 | 3,163 |
| 2009 | 2,869 |
| 2008 | 3,573 |
| 2007 | 4,104 |
| 2006 | 1,415 |
| Total | 93,262 |
Download Historic Sales Data


Embedded Code
See more widgetsSources: Manufacturers