Last updated: January 10, 2022
Mercedes-Benz Total Canada Sales Statistics by Year
Mercedes-Benz Total Canada Sales Statistics by Quarter
Current Lineup
Discontinued Models
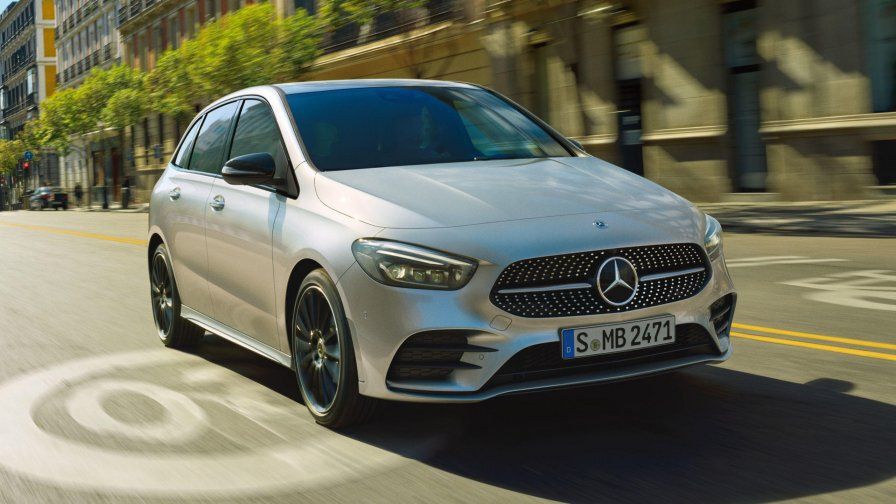
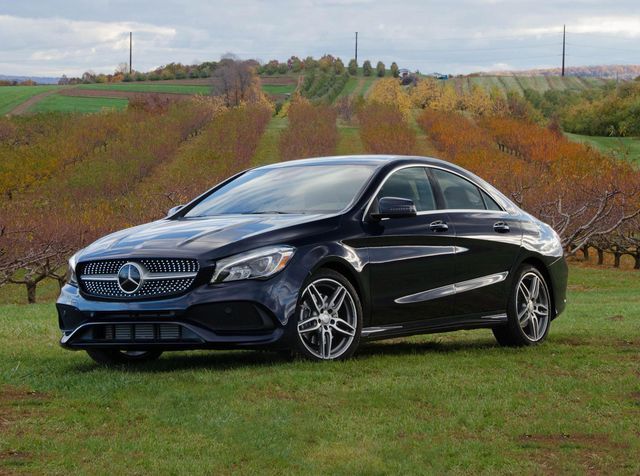
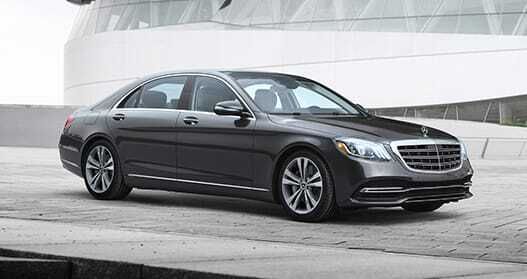
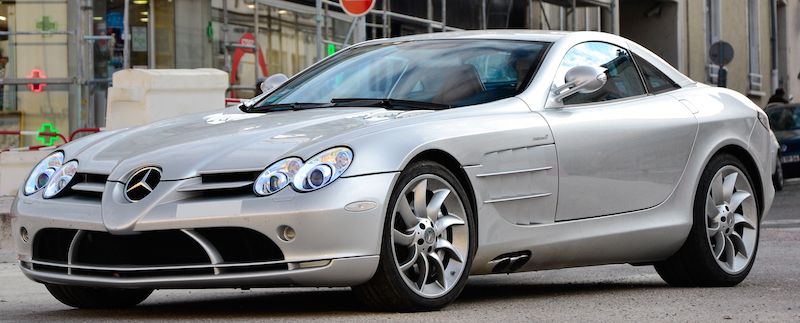
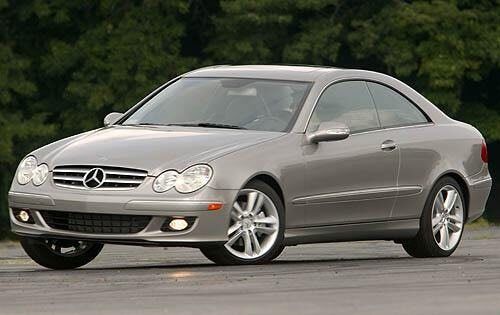
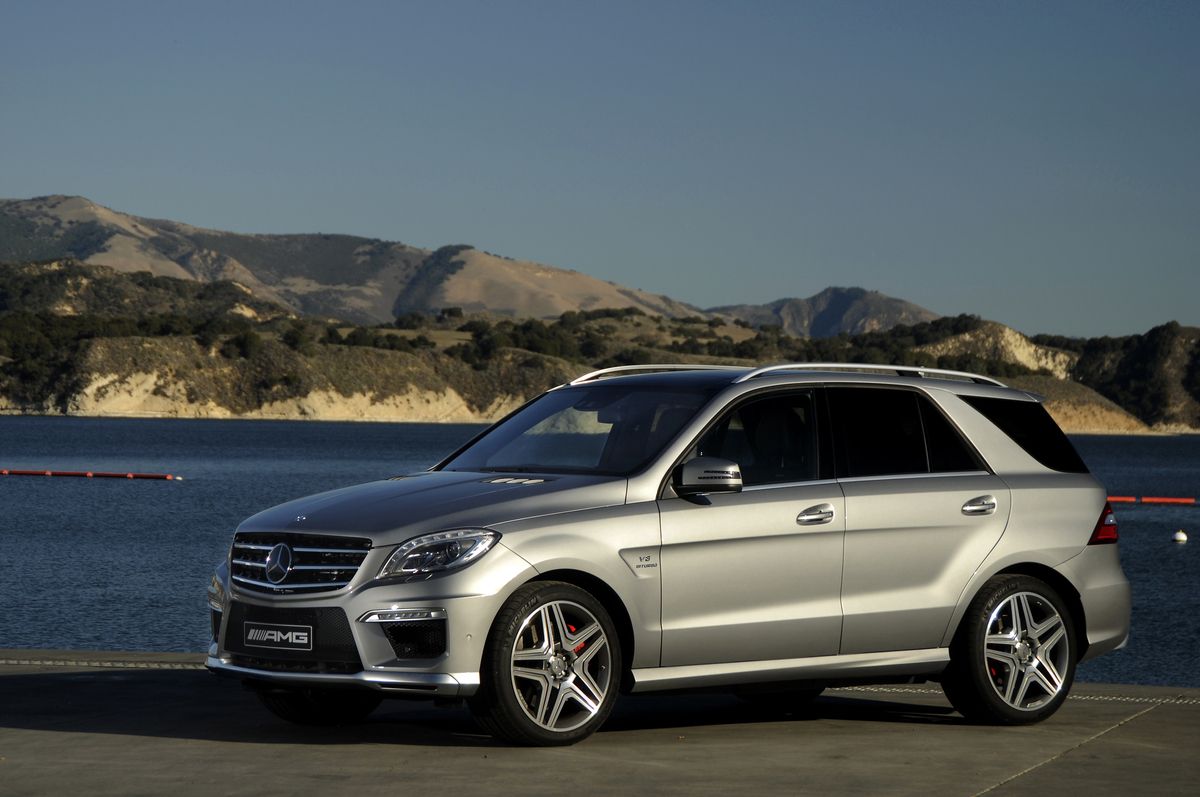
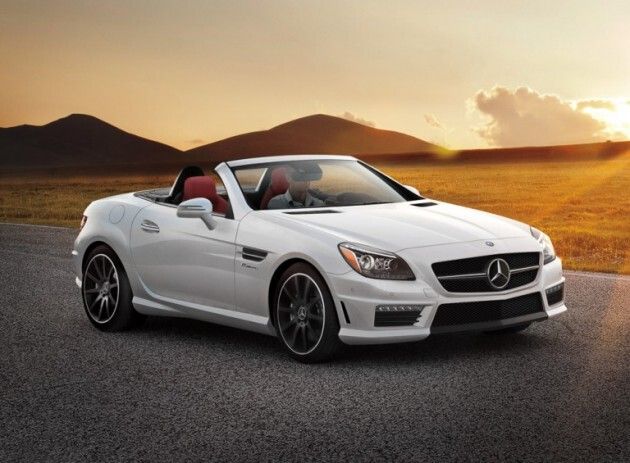
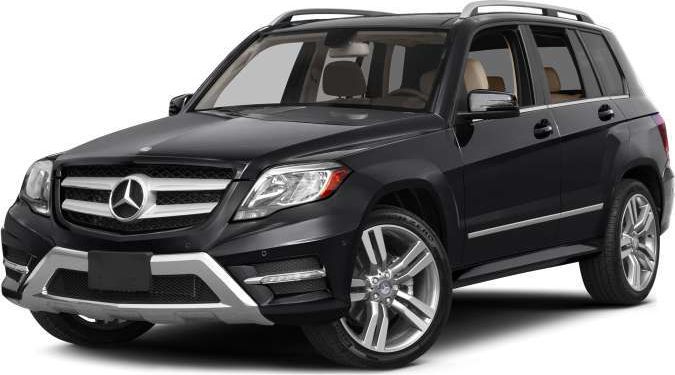
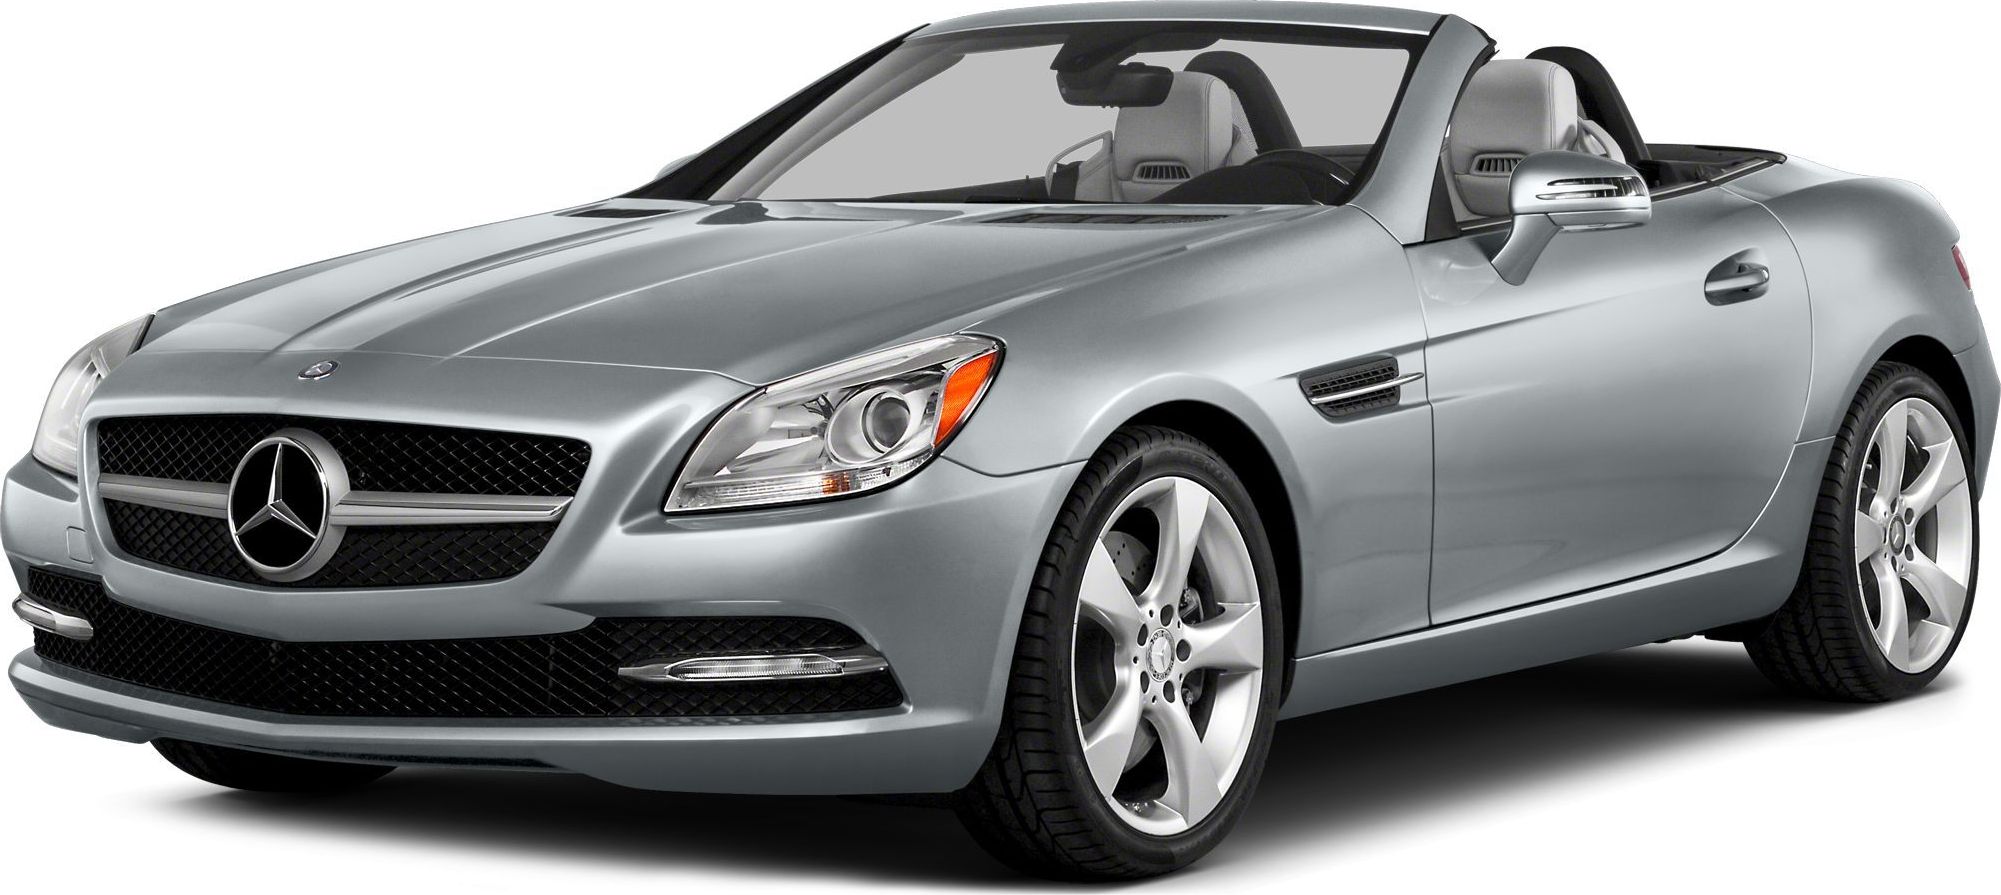
Mercedes-Benz includes the cars 2022 A Class, 2023 AMG GT, 2019 B Class, 2024 C Class, 2022 CLA, 2009 CLK, 2022 CLS, 2023 E/CLS, 2023 G-Class, 2023 G/GL, 2022 GLA, 2024 GLB-Class, 2015 GLK, 2023 GLS-Class, 2015 M Class/GLE, 2023 Metris, 2013 R Class, 2023 S/CL Class, 2016 SLK, SLR, 2023 SL/Roadster, 2015 SLS, 2018 Sprinter, Van
Loading, please wait
Year | Q1 | Q2 | Q3 | Q4 |
|---|---|---|---|---|
| 2005 | 450 | 844 | 956 | 683 |
| 2006 | 3,286 | 4,517 | 4,128 | 4,504 |
| 2007 | 3,985 | 4,987 | 4,380 | 4,824 |
| 2008 | 4,463 | 6,817 | 5,934 | 5,635 |
| 2009 | 5,034 | 7,487 | 6,546 | 6,367 |
| 2010 | 6,335 | 8,541 | 6,955 | 7,962 |
| 2011 | 6,618 | 9,116 | 5,667 | 8,697 |
| 2012 | 8,357 | 10,365 | 7,746 | 8,801 |
| 2013 | 7,899 | 9,960 | 9,384 | 9,624 |
| 2014 | 8,681 | 11,002 | 9,877 | 10,784 |
| 2015 | 9,660 | 10,726 | 11,735 | 11,474 |
| 2016 | 10,818 | 13,784 | 12,477 | 11,755 |
| 2017 | 13,113 | 14,733 | 13,999 | 12,847 |
| 2018 | 12,614 | 15,252 | 11,840 | 12,381 |
| 2019 | 10,809 | 11,895 | 12,203 | 10,028 |
| 2020 | 6,366 | 6,868 | 10,891 | 9,674 |
| 2021 | 9,132 | 9,398 | 9,693 | 8,018 |
Loading, please wait
Year | Sales |
|---|---|
| 2021 | 36,241 |
| 2020 | 33,799 |
| 2019 | 44,935 |
| 2018 | 52,087 |
| 2017 | 54,692 |
| 2016 | 48,834 |
| 2015 | 43,595 |
| 2014 | 40,344 |
| 2013 | 36,867 |
| 2012 | 35,269 |
| 2011 | 30,098 |
| 2010 | 29,793 |
| 2009 | 25,434 |
| 2008 | 22,849 |
| 2007 | 18,176 |
| 2006 | 16,435 |
| 2005 | 2,933 |
| Total | 572,381 |


