Key Stats
How many CR-V did Honda sell in 2022?
Honda sold 4,569 CR-V in 2022. (From Jan - Feb 2022)
How many CR-V did Honda sell in February 2022?
Honda sold 2,309 CR-V in February 2022.
How many CR-V did Honda sell in 2021?
Honda sold 50,935 CR-V in 2021. In 2020, Honda sold 51,854 CR-V. They sold 919 more units in year 2020 compared to 2021 with a percent loss of 1.77% YoY.
Overview
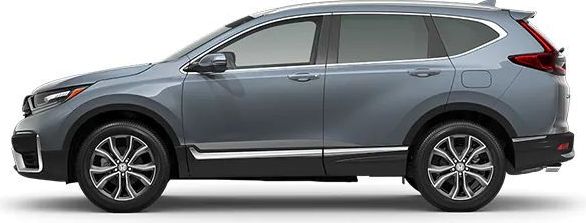
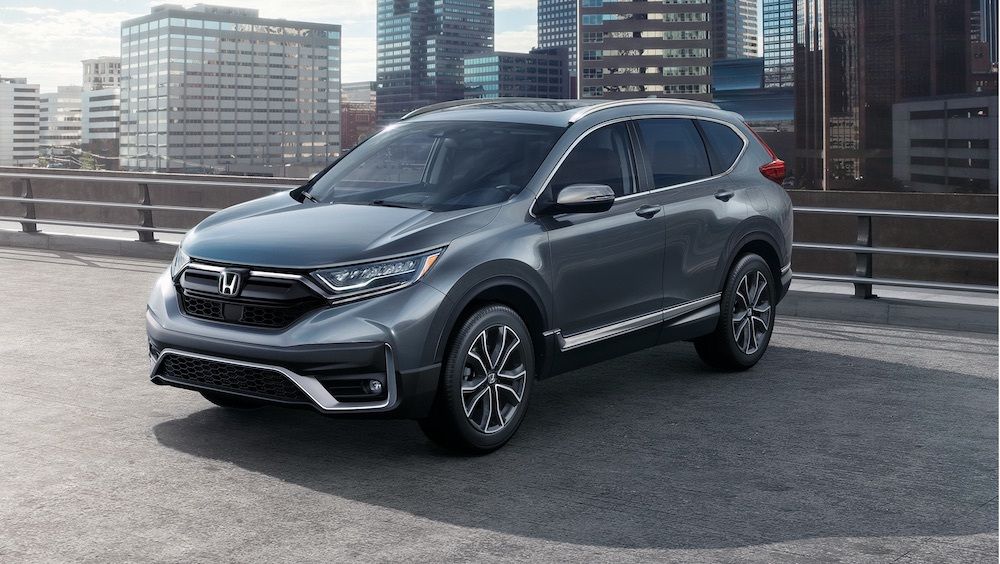
The 2022 Honda CR-V is a vehicle from automaker Honda.
How Much Does the 2022 Honda CR-V Cost?
The 2022 Honda CR-V starts at $30,770 MSRP. Fully loaded, the Honda CR-V will cost you about $44,670.
Honda CR-V Engine, Transmission, and Performance Numbers
Honda CR-V delivers 190 horsepower with 179 ft-lb torque delivered through a front-wheel-drive drivetrain.
List of Honda CR-V Competitors
Some of Honda CR-V competitors include the Hyundai Santa Fe, Mazda CX-5, Nissan Rogue, Subaru Forester, Subaru Outback, Toyota RAV4, Hyundai Tucson, Kia Sorento, Kia Sportage, Mazda CX-30, Nissan Murano and Subaru Ascent.
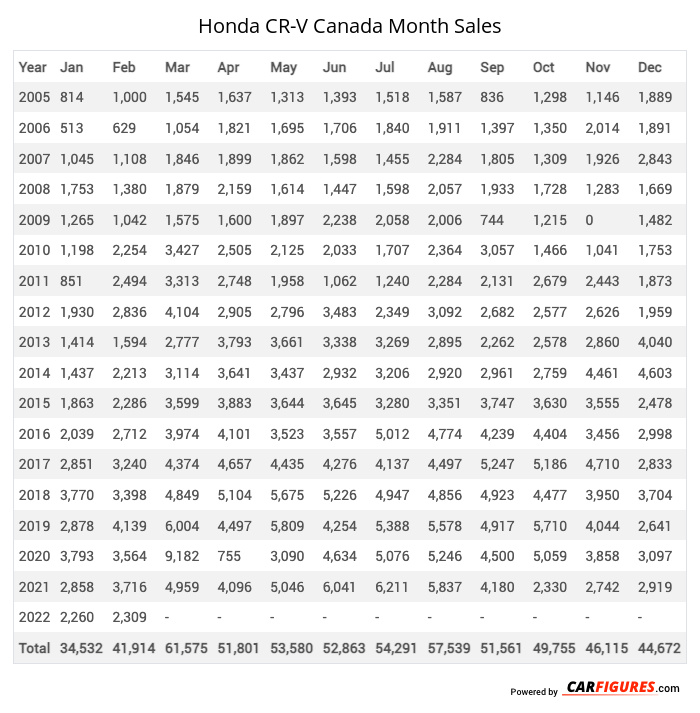
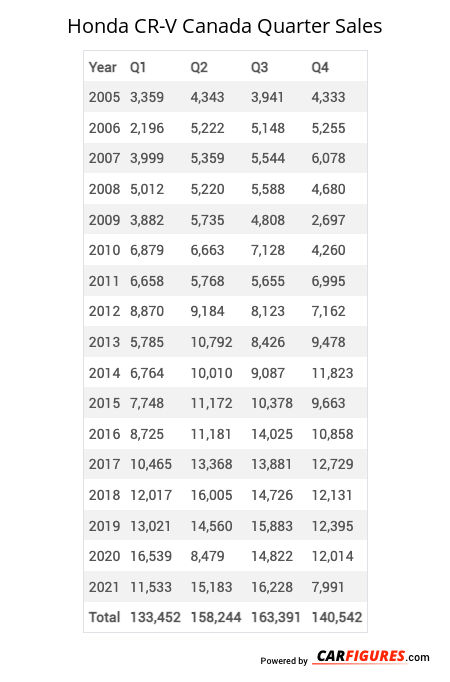
Honda CR-V Canadian Sale figures by year, quarter, and month are presented below. Including the most up to date sales data for the Honda CR-V. See how the Honda CR-V stacks up the other models in the Compact Crossover/SUVs, Crossover/SUVS segments.
Year | Jan | Feb | Mar | Apr | May | Jun | Jul | Aug | Sep | Oct | Nov | Dec |
|---|---|---|---|---|---|---|---|---|---|---|---|---|
| 2005 | 814 | 1,000 | 1,545 | 1,637 | 1,313 | 1,393 | 1,518 | 1,587 | 836 | 1,298 | 1,146 | 1,889 |
| 2006 | 513 | 629 | 1,054 | 1,821 | 1,695 | 1,706 | 1,840 | 1,911 | 1,397 | 1,350 | 2,014 | 1,891 |
| 2007 | 1,045 | 1,108 | 1,846 | 1,899 | 1,862 | 1,598 | 1,455 | 2,284 | 1,805 | 1,309 | 1,926 | 2,843 |
| 2008 | 1,753 | 1,380 | 1,879 | 2,159 | 1,614 | 1,447 | 1,598 | 2,057 | 1,933 | 1,728 | 1,283 | 1,669 |
| 2009 | 1,265 | 1,042 | 1,575 | 1,600 | 1,897 | 2,238 | 2,058 | 2,006 | 744 | 1,215 | 0 | 1,482 |
| 2010 | 1,198 | 2,254 | 3,427 | 2,505 | 2,125 | 2,033 | 1,707 | 2,364 | 3,057 | 1,466 | 1,041 | 1,753 |
| 2011 | 851 | 2,494 | 3,313 | 2,748 | 1,958 | 1,062 | 1,240 | 2,284 | 2,131 | 2,679 | 2,443 | 1,873 |
| 2012 | 1,930 | 2,836 | 4,104 | 2,905 | 2,796 | 3,483 | 2,349 | 3,092 | 2,682 | 2,577 | 2,626 | 1,959 |
| 2013 | 1,414 | 1,594 | 2,777 | 3,793 | 3,661 | 3,338 | 3,269 | 2,895 | 2,262 | 2,578 | 2,860 | 4,040 |
| 2014 | 1,437 | 2,213 | 3,114 | 3,641 | 3,437 | 2,932 | 3,206 | 2,920 | 2,961 | 2,759 | 4,461 | 4,603 |
| 2015 | 1,863 | 2,286 | 3,599 | 3,883 | 3,644 | 3,645 | 3,280 | 3,351 | 3,747 | 3,630 | 3,555 | 2,478 |
| 2016 | 2,039 | 2,712 | 3,974 | 4,101 | 3,523 | 3,557 | 5,012 | 4,774 | 4,239 | 4,404 | 3,456 | 2,998 |
| 2017 | 2,851 | 3,240 | 4,374 | 4,657 | 4,435 | 4,276 | 4,137 | 4,497 | 5,247 | 5,186 | 4,710 | 2,833 |
| 2018 | 3,770 | 3,398 | 4,849 | 5,104 | 5,675 | 5,226 | 4,947 | 4,856 | 4,923 | 4,477 | 3,950 | 3,704 |
| 2019 | 2,878 | 4,139 | 6,004 | 4,497 | 5,809 | 4,254 | 5,388 | 5,578 | 4,917 | 5,710 | 4,044 | 2,641 |
| 2020 | 3,793 | 3,564 | 9,182 | 755 | 3,090 | 4,634 | 5,076 | 5,246 | 4,500 | 5,059 | 3,858 | 3,097 |
| 2021 | 2,858 | 3,716 | 4,959 | 4,096 | 5,046 | 6,041 | 6,211 | 5,837 | 4,180 | 2,330 | 2,742 | 2,919 |
| 2022 | 2,260 | 2,309 | - | - | - | - | - | - | - | - | - | - |
| Total | 34,532 | 41,914 | 61,575 | 51,801 | 53,580 | 52,863 | 54,291 | 57,539 | 51,561 | 49,755 | 46,115 | 44,672 |
Year | Q1 | Q2 | Q3 | Q4 |
|---|---|---|---|---|
| 2005 | 3,359 | 4,343 | 3,941 | 4,333 |
| 2006 | 2,196 | 5,222 | 5,148 | 5,255 |
| 2007 | 3,999 | 5,359 | 5,544 | 6,078 |
| 2008 | 5,012 | 5,220 | 5,588 | 4,680 |
| 2009 | 3,882 | 5,735 | 4,808 | 2,697 |
| 2010 | 6,879 | 6,663 | 7,128 | 4,260 |
| 2011 | 6,658 | 5,768 | 5,655 | 6,995 |
| 2012 | 8,870 | 9,184 | 8,123 | 7,162 |
| 2013 | 5,785 | 10,792 | 8,426 | 9,478 |
| 2014 | 6,764 | 10,010 | 9,087 | 11,823 |
| 2015 | 7,748 | 11,172 | 10,378 | 9,663 |
| 2016 | 8,725 | 11,181 | 14,025 | 10,858 |
| 2017 | 10,465 | 13,368 | 13,881 | 12,729 |
| 2018 | 12,017 | 16,005 | 14,726 | 12,131 |
| 2019 | 13,021 | 14,560 | 15,883 | 12,395 |
| 2020 | 16,539 | 8,479 | 14,822 | 12,014 |
| 2021 | 11,533 | 15,183 | 16,228 | 7,991 |
| Total | 133,452 | 158,244 | 163,391 | 140,542 |
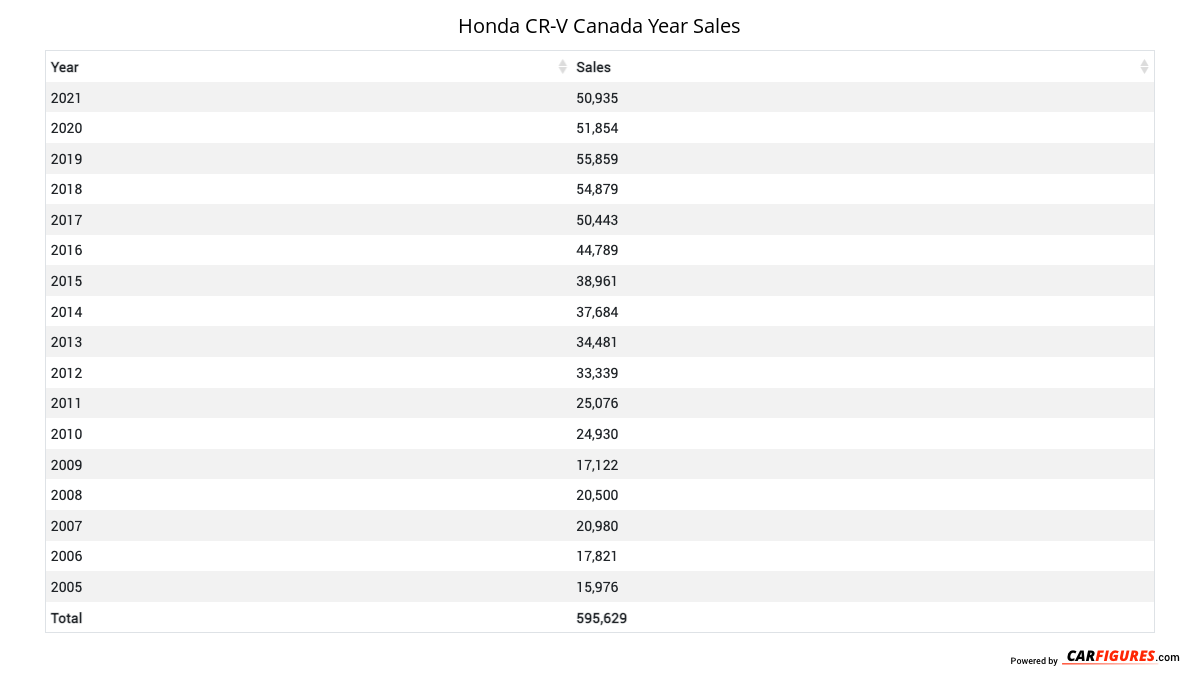
Year | Sales |
|---|---|
| 2021 | 50,935 |
| 2020 | 51,854 |
| 2019 | 55,859 |
| 2018 | 54,879 |
| 2017 | 50,443 |
| 2016 | 44,789 |
| 2015 | 38,961 |
| 2014 | 37,684 |
| 2013 | 34,481 |
| 2012 | 33,339 |
| 2011 | 25,076 |
| 2010 | 24,930 |
| 2009 | 17,122 |
| 2008 | 20,500 |
| 2007 | 20,980 |
| 2006 | 17,821 |
| 2005 | 15,976 |
| Total | 595,629 |
Download Historic Sales Data
Embedded Code
See more widgetsSources: Manufacturers