Key Stats
How many CR-V did Honda sell in 2025?
Honda sold 103,325 CR-V in 2025. (From Jan - Mar 2025)
How many CR-V did Honda sell in March 2025?
Honda sold 45,587 CR-V in March 2025.
How many CR-V did Honda sell in 2024?
Honda sold 363,388 CR-V in 2024. In 2023, Honda sold 361,457 CR-V. They sold 1,931 more units in 2024 compared to 2023 with a percent gain of 0.53% YoY.
Overview
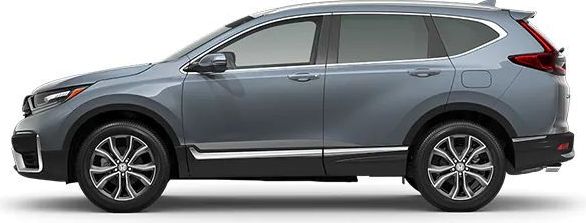
The 2022 Honda CR-V is a vehicle from automaker Honda.
How Much Does the 2022 Honda CR-V Cost?
The 2022 Honda CR-V starts at $26,400 MSRP. Fully loaded, the Honda CR-V will cost you about $36,200.
Honda CR-V Engine, Transmission, and Performance Numbers
Honda CR-V is powered by a 1.5-liter engine with a Front Wheel Drive powertrain that makes 190 -hp and 179 lb-ft torque. The transmission on the Honda CR-V is an Continuously Variable.
List of Honda CR-V Competitors
Some of Honda CR-V competitors include the Toyota RAV4, Nissan Rogue and Subaru Forester.
Honda CR-V United States Sale figures by year, quarter, and month are presented below. Including the most up to date sales data for the Honda CR-V. See how the Honda CR-V stacks up the other models in the Compact Crossover/SUVs, Crossover/SUVS segments.
Year | Jan | Feb | Mar | Apr | May | Jun | Jul | Aug | Sep | Oct | Nov | Dec |
|---|---|---|---|---|---|---|---|---|---|---|---|---|
| 2005 | 10,160 | 11,192 | 13,639 | 13,149 | 12,627 | 12,668 | 16,699 | 14,721 | 9,889 | 10,850 | 10,746 | 13,879 |
| 2006 | 9,325 | 10,321 | 12,705 | 13,505 | 13,804 | 12,394 | 15,464 | 16,321 | 12,185 | 20,413 | 16,242 | 17,349 |
| 2007 | 14,390 | 13,524 | 19,658 | 17,379 | 19,513 | 19,715 | 20,083 | 23,192 | 19,769 | 16,780 | 16,242 | 18,659 |
| 2008 | 16,016 | 15,694 | 18,974 | 18,374 | 19,959 | 15,794 | 17,419 | 19,866 | 15,928 | 13,169 | 12,153 | 13,933 |
| 2009 | 13,143 | 12,370 | 12,959 | 12,175 | 14,550 | 13,720 | 19,151 | 30,284 | 14,554 | 15,667 | 13,955 | 18,686 |
| 2010 | 9,672 | 11,828 | 14,848 | 16,661 | 17,820 | 16,041 | 20,058 | 19,451 | 17,907 | 18,040 | 18,263 | 23,125 |
| 2011 | 16,339 | 19,096 | 21,998 | 21,683 | 16,307 | 15,493 | 13,943 | 16,572 | 19,604 | 19,326 | 16,426 | 21,586 |
| 2012 | 18,960 | 24,759 | 30,868 | 23,961 | 25,186 | 23,282 | 20,554 | 23,877 | 22,268 | 20,449 | 22,333 | 25,976 |
| 2013 | 18,167 | 20,668 | 26,897 | 26,519 | 27,298 | 26,572 | 27,226 | 34,654 | 21,439 | 22,554 | 23,509 | 28,759 |
| 2014 | 18,232 | 20,759 | 28,657 | 28,485 | 32,430 | 26,129 | 28,522 | 34,079 | 23,722 | 29,257 | 32,378 | 32,593 |
| 2015 | 23,211 | 22,298 | 27,618 | 29,452 | 32,090 | 28,349 | 31,785 | 34,771 | 29,925 | 29,032 | 25,931 | 31,185 |
| 2016 | 19,208 | 25,250 | 26,730 | 28,913 | 29,359 | 29,615 | 36,017 | 36,517 | 31,884 | 30,306 | 25,758 | 37,778 |
| 2017 | 29,287 | 31,898 | 32,872 | 32,671 | 32,186 | 28,342 | 31,761 | 30,960 | 30,956 | 27,773 | 32,206 | 36,983 |
| 2018 | 24,326 | 25,852 | 31,868 | 28,323 | 35,905 | 33,306 | 32,844 | 34,610 | 30,587 | 27,825 | 31,488 | 42,079 |
| 2019 | 29,152 | 26,304 | 31,824 | 28,344 | 30,893 | 30,427 | 33,656 | 44,235 | 25,904 | 33,344 | 33,987 | 36,098 |
| 2020 | 26,027 | 28,268 | 16,891 | 12,201 | 29,023 | 26,488 | 30,473 | 34,391 | 33,572 | 32,415 | 25,633 | 38,120 |
| 2021 | 25,806 | 30,249 | 37,711 | 40,779 | 42,090 | 36,564 | 31,530 | 27,928 | 17,483 | 25,393 | 20,682 | 25,056 |
| 2022 | 13,404 | 15,232 | 29,943 | 18,000 | 17,158 | 22,865 | 21,799 | 18,081 | 22,205 | 20,517 | 19,666 | 19,285 |
| 2023 | 20,031 | 16,126 | 31,084 | 31,776 | 33,521 | 31,159 | 33,097 | 30,991 | 34,566 | 31,397 | 31,412 | 36,297 |
| 2024 | 26,352 | 32,031 | 36,655 | 32,232 | 37,224 | 31,710 | 34,216 | 38,527 | 29,217 | 30,826 | 34,398 | 0 |
| 2025 | 27,280 | 30,458 | 45,587 | - | - | - | - | - | - | - | - | - |
| Total | 408,488 | 444,177 | 549,986 | 474,582 | 518,943 | 480,633 | 516,297 | 564,028 | 463,564 | 475,333 | 463,408 | 517,426 |
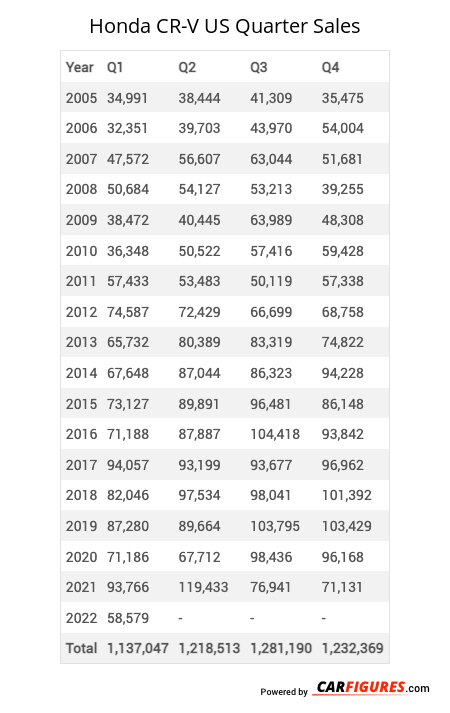
Year | Q1 | Q2 | Q3 | Q4 |
|---|---|---|---|---|
| 2005 | 34,991 | 38,444 | 41,309 | 35,475 |
| 2006 | 32,351 | 39,703 | 43,970 | 54,004 |
| 2007 | 47,572 | 56,607 | 63,044 | 51,681 |
| 2008 | 50,684 | 54,127 | 53,213 | 39,255 |
| 2009 | 38,472 | 40,445 | 63,989 | 48,308 |
| 2010 | 36,348 | 50,522 | 57,416 | 59,428 |
| 2011 | 57,433 | 53,483 | 50,119 | 57,338 |
| 2012 | 74,587 | 72,429 | 66,699 | 68,758 |
| 2013 | 65,732 | 80,389 | 83,319 | 74,822 |
| 2014 | 67,648 | 87,044 | 86,323 | 94,228 |
| 2015 | 73,127 | 89,891 | 96,481 | 86,148 |
| 2016 | 71,188 | 87,887 | 104,418 | 93,842 |
| 2017 | 94,057 | 93,199 | 93,677 | 96,962 |
| 2018 | 82,046 | 97,534 | 98,041 | 101,392 |
| 2019 | 87,280 | 89,664 | 103,795 | 103,429 |
| 2020 | 71,186 | 67,712 | 98,436 | 96,168 |
| 2021 | 93,766 | 119,433 | 76,941 | 71,131 |
| 2022 | 58,579 | 58,023 | 62,085 | 59,468 |
| 2023 | 67,241 | 96,456 | 98,654 | 99,106 |
| 2024 | 95,038 | 101,166 | 101,960 | 65,224 |
| 2025 | 103,325 | - | - | - |
| Total | 1,402,651 | 1,474,158 | 1,543,889 | 1,456,167 |
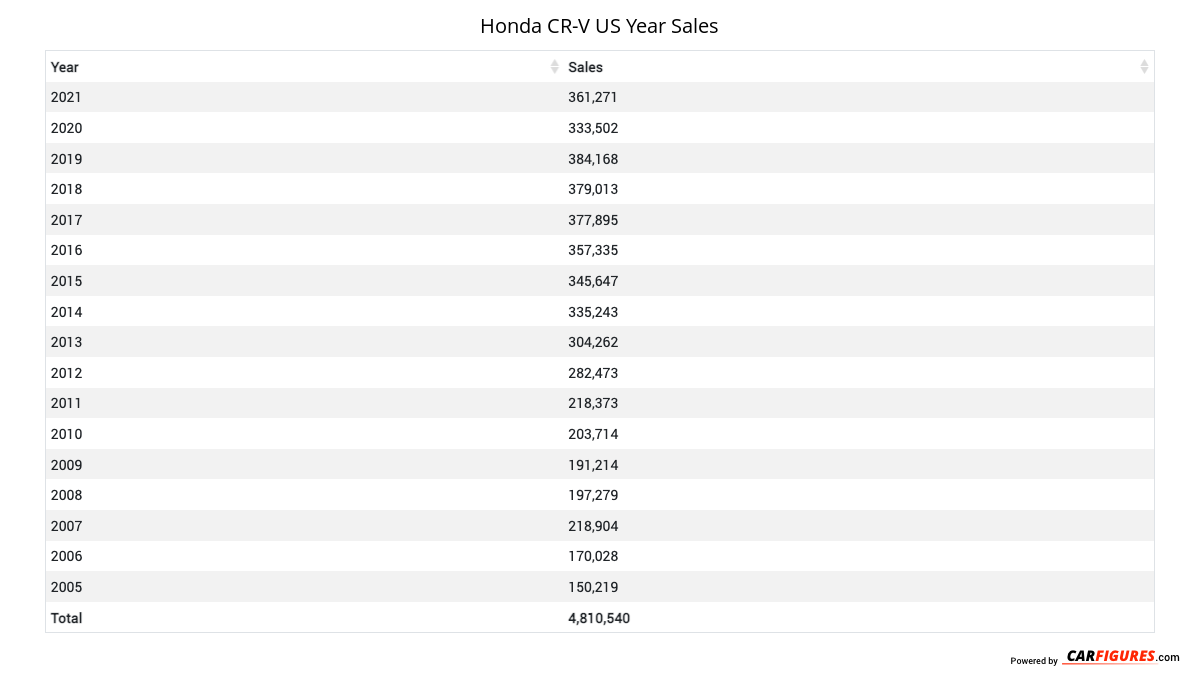
Year | Sales |
|---|---|
| 2024 | 363,388 |
| 2023 | 361,457 |
| 2022 | 238,155 |
| 2021 | 361,271 |
| 2020 | 333,502 |
| 2019 | 384,168 |
| 2018 | 379,013 |
| 2017 | 377,895 |
| 2016 | 357,335 |
| 2015 | 345,647 |
| 2014 | 335,243 |
| 2013 | 304,262 |
| 2012 | 282,473 |
| 2011 | 218,373 |
| 2010 | 203,714 |
| 2009 | 191,214 |
| 2008 | 197,279 |
| 2007 | 218,904 |
| 2006 | 170,028 |
| 2005 | 150,219 |
| Total | 5,773,540 |
Download Historic Sales Data

Embedded Code
See more widgetsSources: Manufacturers