Key Stats
How many CX-5 did Mazda sell in 2022?
Mazda sold 3,113 CX-5 in 2022. (From Jan - Feb 2022)
How many CX-5 did Mazda sell in February 2022?
Mazda sold 1,304 CX-5 in February 2022.
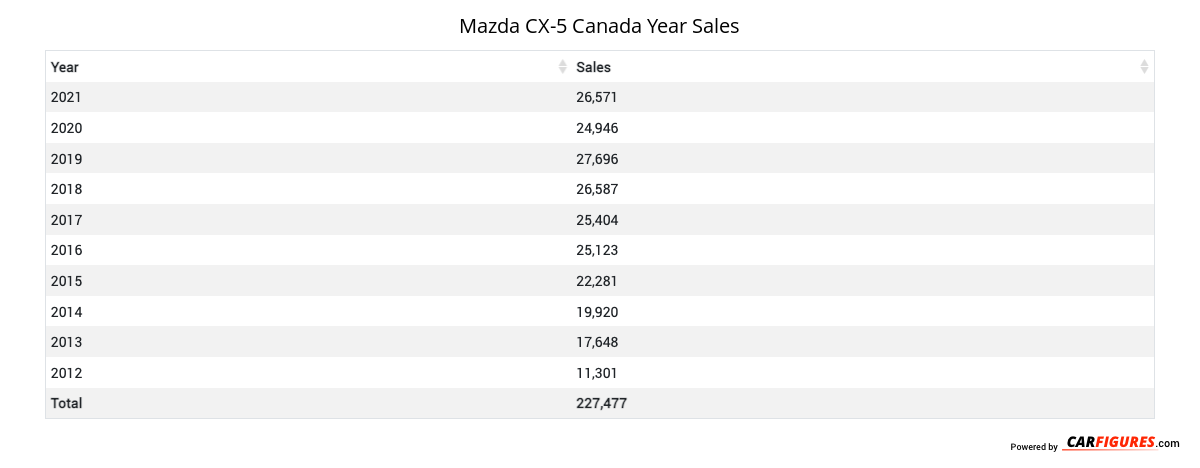
How many CX-5 did Mazda sell in 2021?
Mazda sold 26,571 CX-5 in 2021. In 2020, Mazda sold 24,946 CX-5. They sold 1,625 more units in 2021 compared to 2020 with a percent gain of 6.51% YoY.
Overview
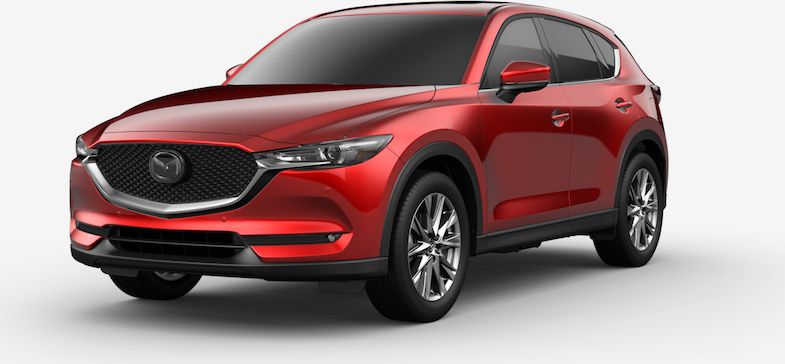
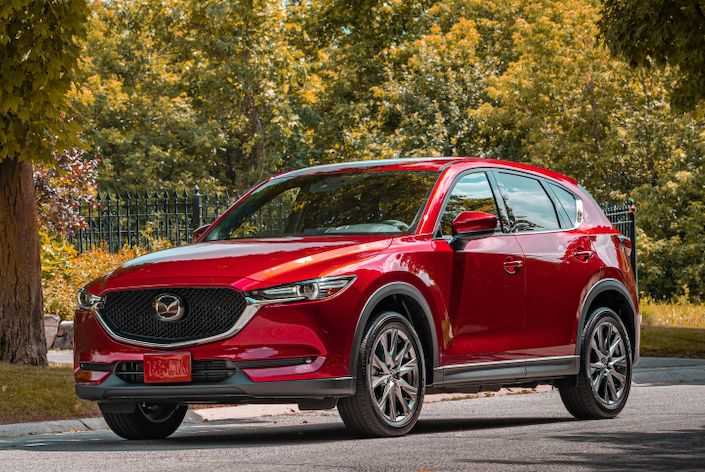
The 2022 Mazda CX-5 is a vehicle from automaker Mazda.
How Much Does the 2022 Mazda CX-5 Cost?
The 2022 Mazda CX-5 starts at $30,200 MSRP. Fully loaded, the Mazda CX-5 will cost you about $43,350.
Mazda CX-5 Engine, Transmission, and Performance Numbers
Mazda CX-5 is powered by a all-wheel-drive powertrain that makes 187 horsepower and 186 ft-lb torque.
List of Mazda CX-5 Competitors
Some of Mazda CX-5 competitors include the Honda CR-V, Nissan Rogue, Subaru Forester, Subaru Outback, Toyota RAV4, Hyundai Santa Fe, Hyundai Tucson, Kia Sorento, Kia Sportage, Nissan Murano, Subaru Ascent and Honda HR-V.
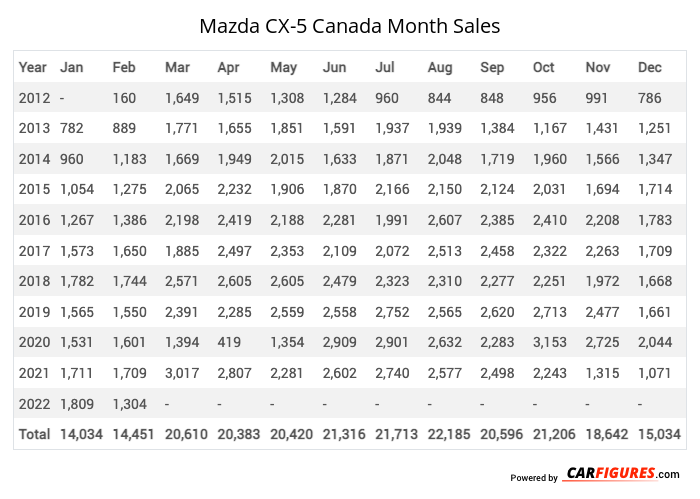
Mazda CX-5 Canadian Sale figures by year, quarter, and month are presented below. Including the most up to date sales data for the Mazda CX-5. See how the Mazda CX-5 stacks up the other models in the Compact Crossover/SUVs, Crossover/SUVS segments.
Year | Jan | Feb | Mar | Apr | May | Jun | Jul | Aug | Sep | Oct | Nov | Dec |
|---|---|---|---|---|---|---|---|---|---|---|---|---|
| 2012 | - | 160 | 1,649 | 1,515 | 1,308 | 1,284 | 960 | 844 | 848 | 956 | 991 | 786 |
| 2013 | 782 | 889 | 1,771 | 1,655 | 1,851 | 1,591 | 1,937 | 1,939 | 1,384 | 1,167 | 1,431 | 1,251 |
| 2014 | 960 | 1,183 | 1,669 | 1,949 | 2,015 | 1,633 | 1,871 | 2,048 | 1,719 | 1,960 | 1,566 | 1,347 |
| 2015 | 1,054 | 1,275 | 2,065 | 2,232 | 1,906 | 1,870 | 2,166 | 2,150 | 2,124 | 2,031 | 1,694 | 1,714 |
| 2016 | 1,267 | 1,386 | 2,198 | 2,419 | 2,188 | 2,281 | 1,991 | 2,607 | 2,385 | 2,410 | 2,208 | 1,783 |
| 2017 | 1,573 | 1,650 | 1,885 | 2,497 | 2,353 | 2,109 | 2,072 | 2,513 | 2,458 | 2,322 | 2,263 | 1,709 |
| 2018 | 1,782 | 1,744 | 2,571 | 2,605 | 2,605 | 2,479 | 2,323 | 2,310 | 2,277 | 2,251 | 1,972 | 1,668 |
| 2019 | 1,565 | 1,550 | 2,391 | 2,285 | 2,559 | 2,558 | 2,752 | 2,565 | 2,620 | 2,713 | 2,477 | 1,661 |
| 2020 | 1,531 | 1,601 | 1,394 | 419 | 1,354 | 2,909 | 2,901 | 2,632 | 2,283 | 3,153 | 2,725 | 2,044 |
| 2021 | 1,711 | 1,709 | 3,017 | 2,807 | 2,281 | 2,602 | 2,740 | 2,577 | 2,498 | 2,243 | 1,315 | 1,071 |
| 2022 | 1,809 | 1,304 | - | - | - | - | - | - | - | - | - | - |
| Total | 14,034 | 14,451 | 20,610 | 20,383 | 20,420 | 21,316 | 21,713 | 22,185 | 20,596 | 21,206 | 18,642 | 15,034 |
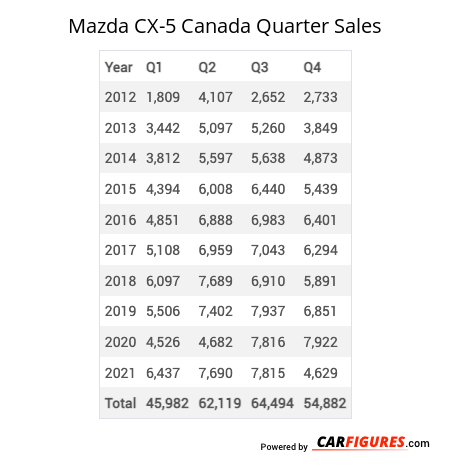
Year | Q1 | Q2 | Q3 | Q4 |
|---|---|---|---|---|
| 2012 | 1,809 | 4,107 | 2,652 | 2,733 |
| 2013 | 3,442 | 5,097 | 5,260 | 3,849 |
| 2014 | 3,812 | 5,597 | 5,638 | 4,873 |
| 2015 | 4,394 | 6,008 | 6,440 | 5,439 |
| 2016 | 4,851 | 6,888 | 6,983 | 6,401 |
| 2017 | 5,108 | 6,959 | 7,043 | 6,294 |
| 2018 | 6,097 | 7,689 | 6,910 | 5,891 |
| 2019 | 5,506 | 7,402 | 7,937 | 6,851 |
| 2020 | 4,526 | 4,682 | 7,816 | 7,922 |
| 2021 | 6,437 | 7,690 | 7,815 | 4,629 |
| Total | 45,982 | 62,119 | 64,494 | 54,882 |
Year | Sales |
|---|---|
| 2021 | 26,571 |
| 2020 | 24,946 |
| 2019 | 27,696 |
| 2018 | 26,587 |
| 2017 | 25,404 |
| 2016 | 25,123 |
| 2015 | 22,281 |
| 2014 | 19,920 |
| 2013 | 17,648 |
| 2012 | 11,301 |
| Total | 227,477 |
Download Historic Sales Data
Embedded Code
See more widgetsSources: Manufacturers