
Key Stats
How many Venza did Toyota sell in 2025?
Toyota sold 672 Venza in 2025. (From Jan - Mar 2025)
How many Venza did Toyota sell in March 2025?
Toyota sold 39 Venza in March 2025.
How many Venza did Toyota sell in 2024?
Toyota sold 32,086 Venza in 2024. In 2023, Toyota sold 29,907 Venza. They sold 2,179 more units in 2024 compared to 2023 with a percent gain of 7.29% YoY.
Overview
The 2022 Toyota Venza is a vehicle from automaker Toyota.
How Much Does the 2022 Toyota Venza Cost?
The 2022 Toyota Venza starts at $32,890 MSRP. Fully loaded, the Toyota Venza will cost you about $40,380.
Toyota Venza Engine, Transmission, and Performance Numbers
Toyota Venza includes a 2.5-liter engine combined with a Continuously Variable (eCVT). This delivers 219 hp with 163 lb-ft torque delivered through a All Wheel Drive drivetrain.
List of Toyota Venza Competitors
Some of Toyota Venza competitors include the Honda Passport, Subaru Outback and Chevrolet Blazer.
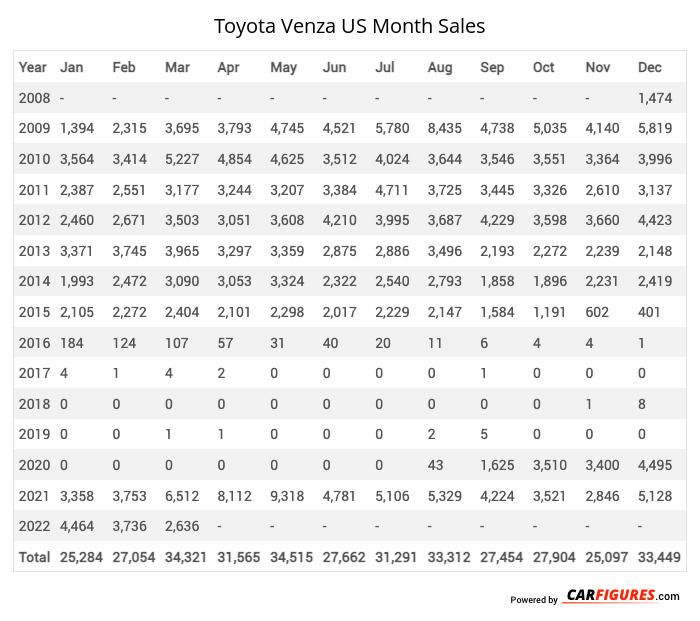
Toyota Venza United States Sale figures by year, quarter, and month are presented below. Including the most up to date sales data for the Toyota Venza. See how the Toyota Venza stacks up the other models in the Crossover/SUVS, Midsize Crossover/SUVs segments.
Year | Jan | Feb | Mar | Apr | May | Jun | Jul | Aug | Sep | Oct | Nov | Dec |
|---|---|---|---|---|---|---|---|---|---|---|---|---|
| 2008 | - | - | - | - | - | - | - | - | - | - | - | 1,474 |
| 2009 | 1,394 | 2,315 | 3,695 | 3,793 | 4,745 | 4,521 | 5,780 | 8,435 | 4,738 | 5,035 | 4,140 | 5,819 |
| 2010 | 3,564 | 3,414 | 5,227 | 4,854 | 4,625 | 3,512 | 4,024 | 3,644 | 3,546 | 3,551 | 3,364 | 3,996 |
| 2011 | 2,387 | 2,551 | 3,177 | 3,244 | 3,207 | 3,384 | 4,711 | 3,725 | 3,445 | 3,326 | 2,610 | 3,137 |
| 2012 | 2,460 | 2,671 | 3,503 | 3,051 | 3,608 | 4,210 | 3,995 | 3,687 | 4,229 | 3,598 | 3,660 | 4,423 |
| 2013 | 3,371 | 3,745 | 3,965 | 3,297 | 3,359 | 2,875 | 2,886 | 3,496 | 2,193 | 2,272 | 2,239 | 2,148 |
| 2014 | 1,993 | 2,472 | 3,090 | 3,053 | 3,324 | 2,322 | 2,540 | 2,793 | 1,858 | 1,896 | 2,231 | 2,419 |
| 2015 | 2,105 | 2,272 | 2,404 | 2,101 | 2,298 | 2,017 | 2,229 | 2,147 | 1,584 | 1,191 | 602 | 401 |
| 2016 | 184 | 124 | 107 | 57 | 31 | 40 | 20 | 11 | 6 | 4 | 4 | 1 |
| 2017 | 4 | 1 | 4 | 2 | 0 | 0 | 0 | 0 | 1 | 0 | 0 | 0 |
| 2018 | 0 | 0 | 0 | 0 | 0 | 0 | 0 | 0 | 0 | 0 | 1 | 8 |
| 2019 | 0 | 0 | 1 | 1 | 0 | 0 | 0 | 2 | 5 | 0 | 0 | 0 |
| 2020 | 0 | 0 | 0 | 0 | 0 | 0 | 0 | 43 | 1,625 | 3,510 | 3,400 | 4,495 |
| 2021 | 3,358 | 3,753 | 6,512 | 8,112 | 9,318 | 4,781 | 5,106 | 5,329 | 4,224 | 3,521 | 2,846 | 5,128 |
| 2022 | 4,464 | 3,736 | 2,636 | 2,309 | 2,975 | 2,546 | 2,064 | 1,098 | 1,303 | 3,705 | 3,923 | 2,924 |
| 2023 | 2,888 | 2,419 | 2,159 | 1,749 | 1,570 | 2,292 | 2,790 | 3,030 | 3,190 | 2,896 | 2,369 | 2,555 |
| 2024 | 2,189 | 2,424 | 3,348 | 4,416 | 5,017 | 4,133 | 3,378 | 3,137 | 1,748 | 803 | 178 | 1,315 |
| 2025 | 502 | 131 | 39 | - | - | - | - | - | - | - | - | - |
| Total | 30,863 | 32,028 | 39,867 | 40,039 | 44,077 | 36,633 | 39,523 | 40,577 | 33,695 | 35,308 | 31,567 | 40,243 |
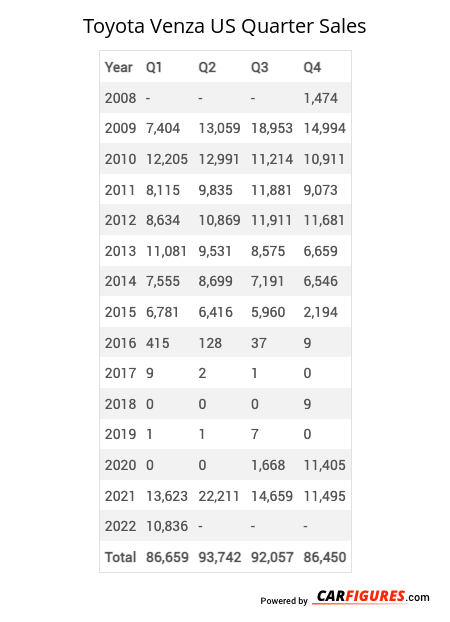
Year | Q1 | Q2 | Q3 | Q4 |
|---|---|---|---|---|
| 2008 | - | - | - | 1,474 |
| 2009 | 7,404 | 13,059 | 18,953 | 14,994 |
| 2010 | 12,205 | 12,991 | 11,214 | 10,911 |
| 2011 | 8,115 | 9,835 | 11,881 | 9,073 |
| 2012 | 8,634 | 10,869 | 11,911 | 11,681 |
| 2013 | 11,081 | 9,531 | 8,575 | 6,659 |
| 2014 | 7,555 | 8,699 | 7,191 | 6,546 |
| 2015 | 6,781 | 6,416 | 5,960 | 2,194 |
| 2016 | 415 | 128 | 37 | 9 |
| 2017 | 9 | 2 | 1 | 0 |
| 2018 | 0 | 0 | 0 | 9 |
| 2019 | 1 | 1 | 7 | 0 |
| 2020 | 0 | 0 | 1,668 | 11,405 |
| 2021 | 13,623 | 22,211 | 14,659 | 11,495 |
| 2022 | 10,836 | 7,830 | 4,465 | 10,552 |
| 2023 | 7,466 | 5,611 | 9,010 | 7,820 |
| 2024 | 7,961 | 13,566 | 8,263 | 2,296 |
| 2025 | 672 | - | - | - |
| Total | 102,758 | 120,749 | 113,795 | 107,118 |
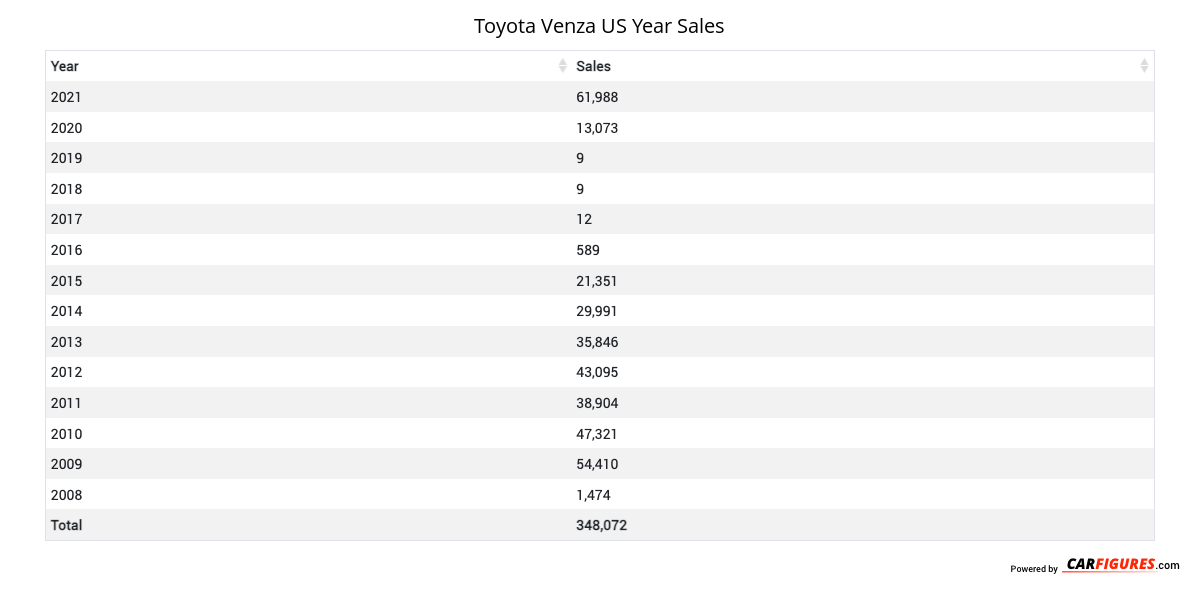
Year | Sales |
|---|---|
| 2024 | 32,086 |
| 2023 | 29,907 |
| 2022 | 33,683 |
| 2021 | 61,988 |
| 2020 | 13,073 |
| 2019 | 9 |
| 2018 | 9 |
| 2017 | 12 |
| 2016 | 589 |
| 2015 | 21,351 |
| 2014 | 29,991 |
| 2013 | 35,846 |
| 2012 | 43,095 |
| 2011 | 38,904 |
| 2010 | 47,321 |
| 2009 | 54,410 |
| 2008 | 1,474 |
| Total | 443,748 |
Download Historic Sales Data
Embedded Code
See more widgetsSources: Manufacturers