

Key Stats
How many Supra did Toyota sell in 2025?
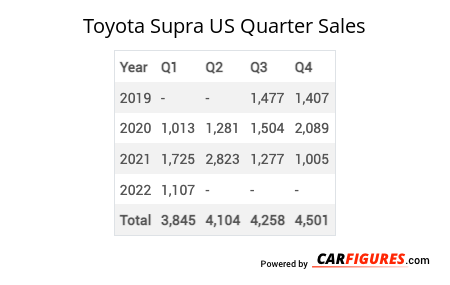
Toyota sold 421 Supra in 2025. (From Jan - Mar 2025)
How many Supra did Toyota sell in March 2025?
Toyota sold 179 Supra in March 2025.
How many Supra did Toyota sell in 2024?
Toyota sold 2,615 Supra in 2024. In 2023, Toyota sold 2,652 Supra. They sold 37 more units in year 2023 compared to 2024 with a percent loss of 1.4% YoY.
Overview
The Toyota Supra is a Coupe with room for 2 people.
How Much Does the 2020 Toyota Supra Cost?
The 2020 Toyota Supra starts at $49,990 MSRP. Fully loaded, the Toyota Supra will cost you about $55,250.
Toyota Supra Engine, Transmission, and Performance Numbers
Toyota Supra is powered by a 3.0-liter I-6 engine with a RWD powertrain that makes 335 -hp and 365 lbs.-ft. Torque. The transmission on the Toyota Supra is an 8-speed automatic.
2020 Toyota Supra Fuel Economy
The 2020 Toyota Supra has a rating of 26 mpg combined. The 2020 Toyota Supra can hold 13 gallons of fuel for a combined range of 338 miles.
2020 Toyota Supra Specifications
The has a curb weight of 3,397 lbs. With an interior passenger volume of 50.9 cu. Ft.
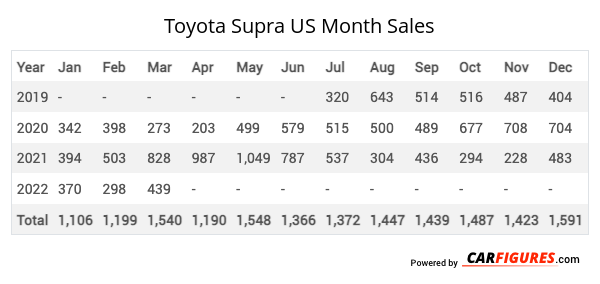
Toyota Supra United States Sale figures by year, quarter, and month are presented below. Including the most up to date sales data for the Toyota Supra. See how the Toyota Supra stacks up the other models in the Cars, Premium Sport/Performance Cars segments.
Year | Jan | Feb | Mar | Apr | May | Jun | Jul | Aug | Sep | Oct | Nov | Dec |
|---|---|---|---|---|---|---|---|---|---|---|---|---|
| 2019 | - | - | - | - | - | - | 320 | 643 | 514 | 516 | 487 | 404 |
| 2020 | 342 | 398 | 273 | 203 | 499 | 579 | 515 | 500 | 489 | 677 | 708 | 704 |
| 2021 | 394 | 503 | 828 | 987 | 1,049 | 787 | 537 | 304 | 436 | 294 | 228 | 483 |
| 2022 | 370 | 298 | 439 | 474 | 540 | 563 | 538 | 413 | 220 | 486 | 353 | 258 |
| 2023 | 307 | 317 | 247 | 276 | 228 | 246 | 157 | 134 | 185 | 85 | 225 | 245 |
| 2024 | 161 | 121 | 202 | 333 | 406 | 272 | 308 | 309 | 217 | 143 | 73 | 70 |
| 2025 | 110 | 132 | 179 | - | - | - | - | - | - | - | - | - |
| Total | 1,684 | 1,769 | 2,168 | 2,273 | 2,722 | 2,447 | 2,375 | 2,303 | 2,061 | 2,201 | 2,074 | 2,164 |
Year | Q1 | Q2 | Q3 | Q4 |
|---|---|---|---|---|
| 2019 | - | - | 1,477 | 1,407 |
| 2020 | 1,013 | 1,281 | 1,504 | 2,089 |
| 2021 | 1,725 | 2,823 | 1,277 | 1,005 |
| 2022 | 1,107 | 1,577 | 1,171 | 1,097 |
| 2023 | 871 | 750 | 476 | 555 |
| 2024 | 484 | 1,011 | 834 | 286 |
| 2025 | 421 | - | - | - |
| Total | 5,621 | 7,442 | 6,739 | 6,439 |
Year | Sales |
|---|---|
| 2024 | 2,615 |
| 2023 | 2,652 |
| 2022 | 4,952 |
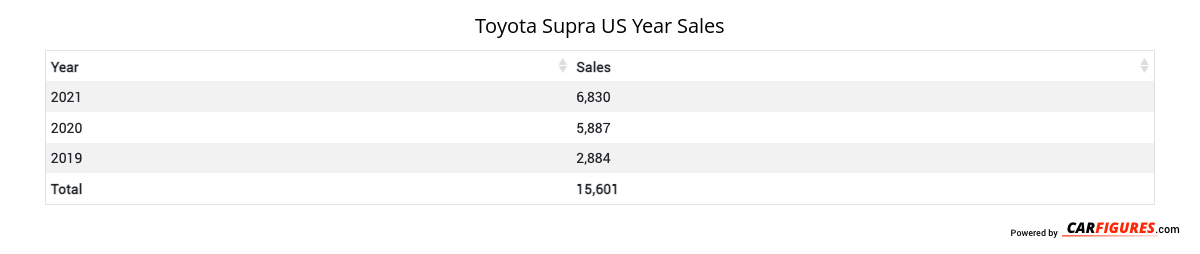
| 2021 | 6,830 |
| 2020 | 5,887 |
| 2019 | 2,884 |
| Total | 25,820 |
Download Historic Sales Data
Embedded Code
See more widgetsSources: Manufacturers