Key Stats
How many Outback did Subaru sell in 2025?
Subaru sold 28,333 Outback in 2025. (From Jan - Mar 2025)
How many Outback did Subaru sell in March 2025?
Subaru sold 17,539 Outback in March 2025.
How many Outback did Subaru sell in 2024?
Subaru sold 168,771 Outback in 2024. In 2023, Subaru sold 161,812 Outback. They sold 6,959 more units in 2024 compared to 2023 with a percent gain of 4.3% YoY.
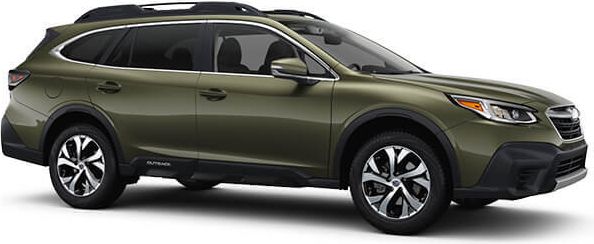
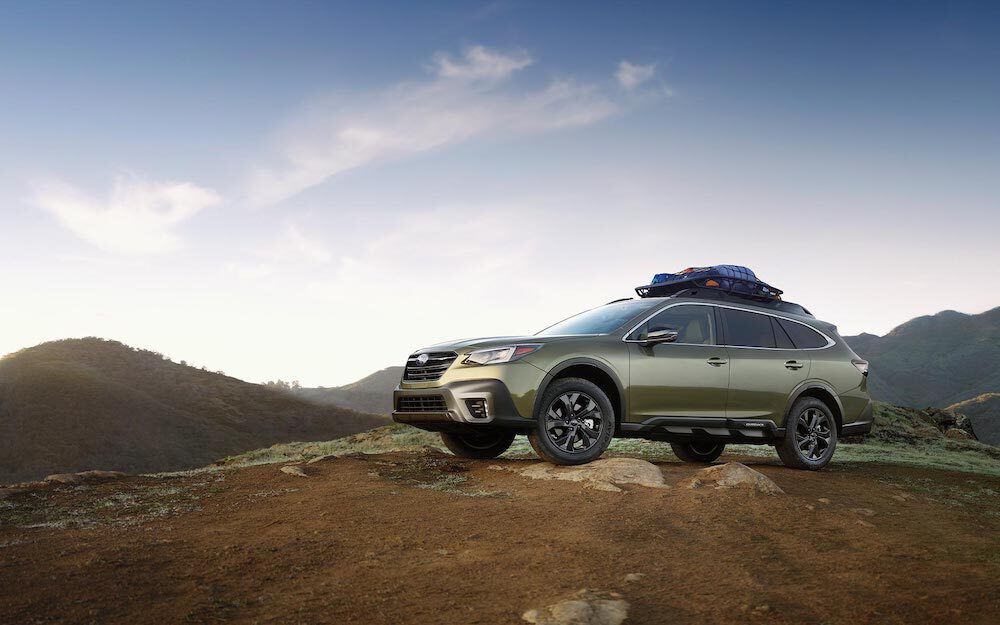
Overview
The 2024 Subaru Outback is a vehicle from automaker Subaru.
How Much Does the 2024 Subaru Outback Cost?
Pricing for the 2024 Subaru Outback starts at $31,195 MSRP and goes up to $42,795 fully loaded.
Subaru Outback Engine, Transmission, and Performance Numbers
Subaru Outback includes a 2.5-liter engine combined with a Lineartronic Continuously Variable. This delivers 182 hp with 176 lb-ft torque delivered through a All Wheel Drive drivetrain.
List of Subaru Outback Competitors
Some of Subaru Outback competitors include the Honda Passport, Hyundai Santa Fe and Ford Edge.
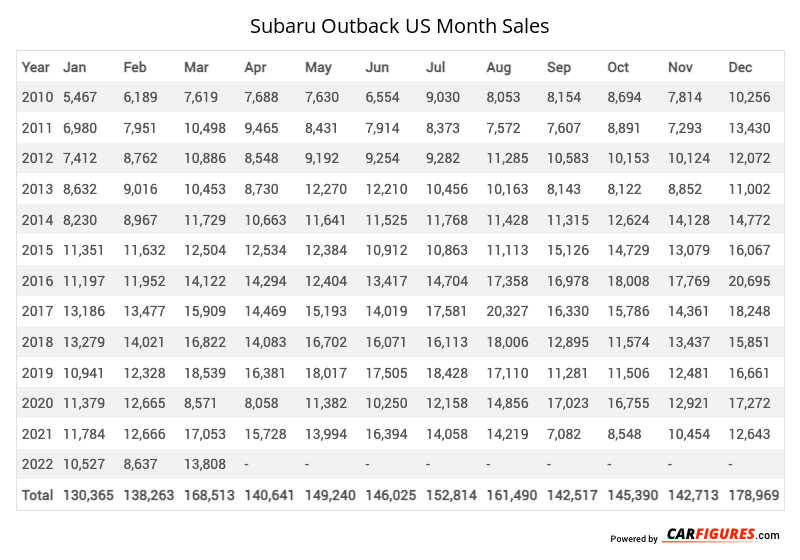
Subaru Outback United States Sale figures by year, quarter, and month are presented below. Including the most up to date sales data for the Subaru Outback.
Year | Jan | Feb | Mar | Apr | May | Jun | Jul | Aug | Sep | Oct | Nov | Dec |
|---|---|---|---|---|---|---|---|---|---|---|---|---|
| 2010 | 5,467 | 6,189 | 7,619 | 7,688 | 7,630 | 6,554 | 9,030 | 8,053 | 8,154 | 8,694 | 7,814 | 10,256 |
| 2011 | 6,980 | 7,951 | 10,498 | 9,465 | 8,431 | 7,914 | 8,373 | 7,572 | 7,607 | 8,891 | 7,293 | 13,430 |
| 2012 | 7,412 | 8,762 | 10,886 | 8,548 | 9,192 | 9,254 | 9,282 | 11,285 | 10,583 | 10,153 | 10,124 | 12,072 |
| 2013 | 8,632 | 9,016 | 10,453 | 8,730 | 12,270 | 12,210 | 10,456 | 10,163 | 8,143 | 8,122 | 8,852 | 11,002 |
| 2014 | 8,230 | 8,967 | 11,729 | 10,663 | 11,641 | 11,525 | 11,768 | 11,428 | 11,315 | 12,624 | 14,128 | 14,772 |
| 2015 | 11,351 | 11,632 | 12,504 | 12,534 | 12,384 | 10,912 | 10,863 | 11,113 | 15,126 | 14,729 | 13,079 | 16,067 |
| 2016 | 11,197 | 11,952 | 14,122 | 14,294 | 12,404 | 13,417 | 14,704 | 17,358 | 16,978 | 18,008 | 17,769 | 20,695 |
| 2017 | 13,186 | 13,477 | 15,909 | 14,469 | 15,193 | 14,019 | 17,581 | 20,327 | 16,330 | 15,786 | 14,361 | 18,248 |
| 2018 | 13,279 | 14,021 | 16,822 | 14,083 | 16,702 | 16,071 | 16,113 | 18,006 | 12,895 | 11,574 | 13,437 | 15,851 |
| 2019 | 10,941 | 12,328 | 18,539 | 16,381 | 18,017 | 17,505 | 18,428 | 17,110 | 11,281 | 11,506 | 12,481 | 16,661 |
| 2020 | 11,379 | 12,665 | 8,571 | 8,058 | 11,382 | 10,250 | 12,158 | 14,856 | 17,023 | 16,755 | 12,921 | 17,272 |
| 2021 | 11,784 | 12,666 | 17,053 | 15,728 | 13,994 | 16,394 | 14,058 | 14,219 | 7,082 | 8,548 | 10,454 | 12,643 |
| 2022 | 10,527 | 8,637 | 13,808 | 16,510 | 14,724 | 13,135 | 8,638 | 10,928 | 8,497 | 11,992 | 15,069 | 14,797 |
| 2023 | 10,414 | 9,108 | 13,245 | 15,263 | 17,146 | 16,225 | 12,430 | 14,503 | 14,545 | 12,396 | 12,233 | 14,304 |
| 2024 | 11,300 | 10,412 | 13,501 | 13,131 | 16,506 | 16,853 | 14,204 | 16,435 | 13,991 | 13,549 | 14,004 | 14,885 |
| 2025 | 10,794 | - | 17,539 | - | - | - | - | - | - | - | - | - |
| Total | 162,873 | 157,783 | 212,798 | 185,545 | 197,616 | 192,238 | 188,086 | 203,356 | 179,550 | 183,327 | 184,019 | 222,955 |
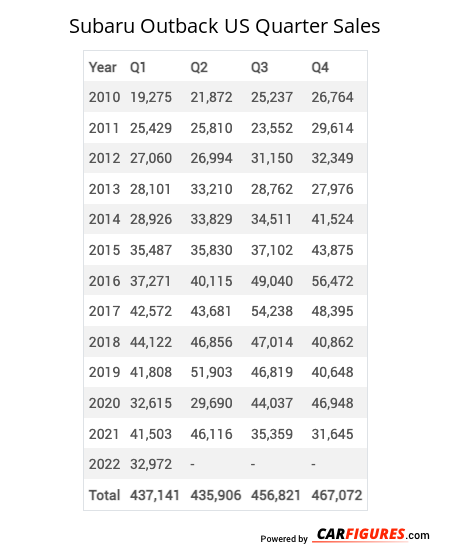
Year | Q1 | Q2 | Q3 | Q4 |
|---|---|---|---|---|
| 2010 | 19,275 | 21,872 | 25,237 | 26,764 |
| 2011 | 25,429 | 25,810 | 23,552 | 29,614 |
| 2012 | 27,060 | 26,994 | 31,150 | 32,349 |
| 2013 | 28,101 | 33,210 | 28,762 | 27,976 |
| 2014 | 28,926 | 33,829 | 34,511 | 41,524 |
| 2015 | 35,487 | 35,830 | 37,102 | 43,875 |
| 2016 | 37,271 | 40,115 | 49,040 | 56,472 |
| 2017 | 42,572 | 43,681 | 54,238 | 48,395 |
| 2018 | 44,122 | 46,856 | 47,014 | 40,862 |
| 2019 | 41,808 | 51,903 | 46,819 | 40,648 |
| 2020 | 32,615 | 29,690 | 44,037 | 46,948 |
| 2021 | 41,503 | 46,116 | 35,359 | 31,645 |
| 2022 | 32,972 | 44,369 | 28,063 | 41,858 |
| 2023 | 32,767 | 48,634 | 41,478 | 38,933 |
| 2024 | 35,213 | 46,490 | 44,630 | 42,438 |
| 2025 | 28,333 | - | - | - |
| Total | 533,454 | 575,399 | 570,992 | 590,301 |
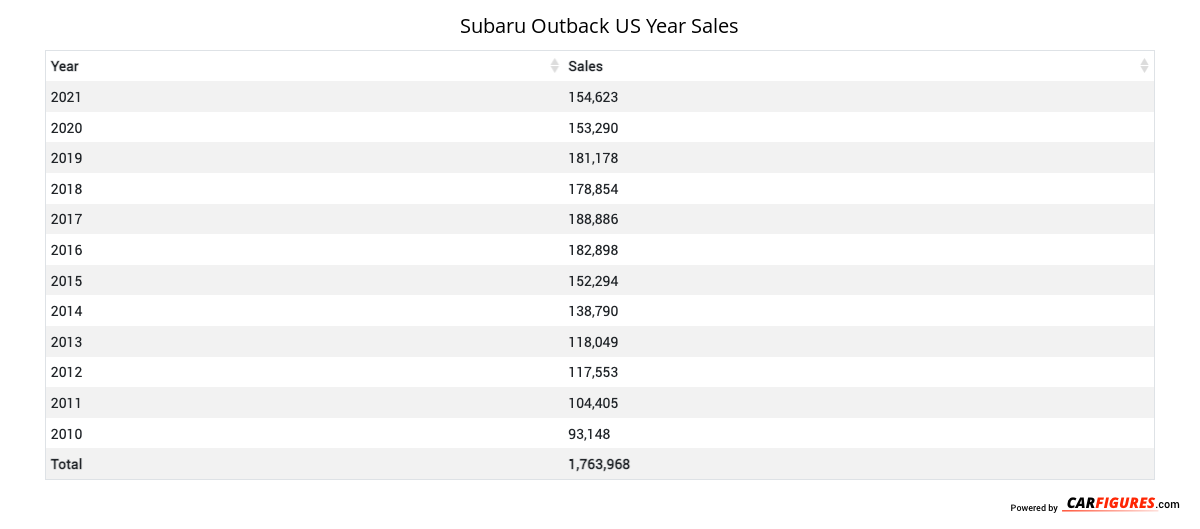
Year | Sales |
|---|---|
| 2024 | 168,771 |
| 2023 | 161,812 |
| 2022 | 147,262 |
| 2021 | 154,623 |
| 2020 | 153,290 |
| 2019 | 181,178 |
| 2018 | 178,854 |
| 2017 | 188,886 |
| 2016 | 182,898 |
| 2015 | 152,294 |
| 2014 | 138,790 |
| 2013 | 118,049 |
| 2012 | 117,553 |
| 2011 | 104,405 |
| 2010 | 93,148 |
| Total | 2,241,813 |
Download Historic Sales Data
Embedded Code
See more widgetsSources: Manufacturers