
Key Stats
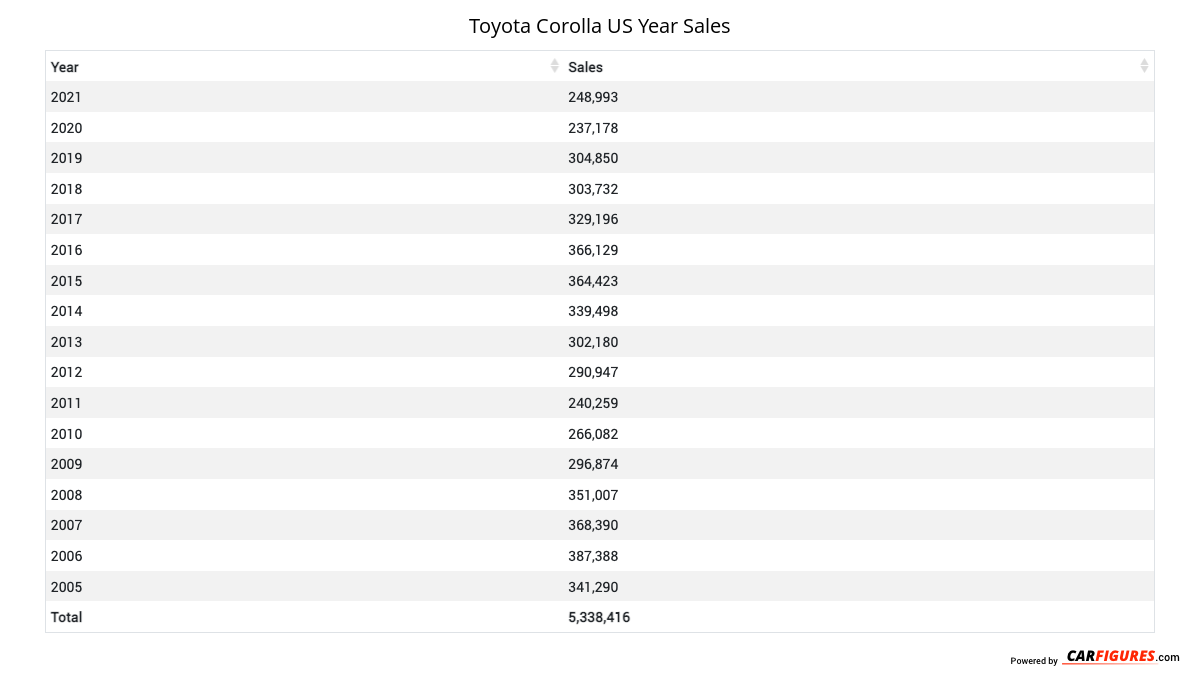
How many Corolla did Toyota sell in 2025?
Toyota sold 55,456 Corolla in 2025. (From Jan - Mar 2025)
How many Corolla did Toyota sell in March 2025?
Toyota sold 21,495 Corolla in March 2025.
How many Corolla did Toyota sell in 2024?
Toyota sold 232,908 Corolla in 2024. In 2023, Toyota sold 232,369 Corolla. They sold 539 more units in 2024 compared to 2023 with a percent gain of 0.23% YoY.
Overview
The 2022 Toyota Corolla is a vehicle from automaker Toyota.
How Much Does the 2022 Toyota Corolla Cost?
Pricing for the 2022 Toyota Corolla starts at $20,175 MSRP and goes up to $28,460 fully loaded.
Toyota Corolla Engine, Transmission, and Performance Numbers
Toyota Corolla is powered by a 1.8-liter engine with a Front Wheel Drive powertrain that makes 139 -hp and 126 lb-ft torque. The transmission on the Toyota Corolla is an Continuously Variable (CVTi-S).
List of Toyota Corolla Competitors
Some of Toyota Corolla competitors include the Honda Civic, Mazda 3 and Hyundai Elantra.
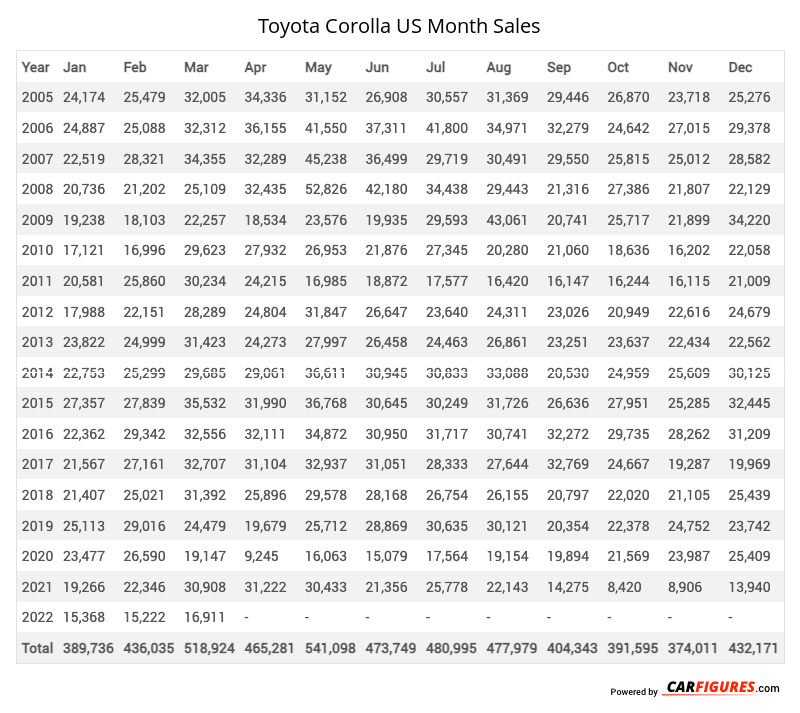
Toyota Corolla United States Sale figures by year, quarter, and month are presented below. Including the most up to date sales data for the Toyota Corolla. See how the Toyota Corolla stacks up the other models in the Cars, Compact Cars segments.
Year | Jan | Feb | Mar | Apr | May | Jun | Jul | Aug | Sep | Oct | Nov | Dec |
|---|---|---|---|---|---|---|---|---|---|---|---|---|
| 2005 | 24,174 | 25,479 | 32,005 | 34,336 | 31,152 | 26,908 | 30,557 | 31,369 | 29,446 | 26,870 | 23,718 | 25,276 |
| 2006 | 24,887 | 25,088 | 32,312 | 36,155 | 41,550 | 37,311 | 41,800 | 34,971 | 32,279 | 24,642 | 27,015 | 29,378 |
| 2007 | 22,519 | 28,321 | 34,355 | 32,289 | 45,238 | 36,499 | 29,719 | 30,491 | 29,550 | 25,815 | 25,012 | 28,582 |
| 2008 | 20,736 | 21,202 | 25,109 | 32,435 | 52,826 | 42,180 | 34,438 | 29,443 | 21,316 | 27,386 | 21,807 | 22,129 |
| 2009 | 19,238 | 18,103 | 22,257 | 18,534 | 23,576 | 19,935 | 29,593 | 43,061 | 20,741 | 25,717 | 21,899 | 34,220 |
| 2010 | 17,121 | 16,996 | 29,623 | 27,932 | 26,953 | 21,876 | 27,345 | 20,280 | 21,060 | 18,636 | 16,202 | 22,058 |
| 2011 | 20,581 | 25,860 | 30,234 | 24,215 | 16,985 | 18,872 | 17,577 | 16,420 | 16,147 | 16,244 | 16,115 | 21,009 |
| 2012 | 17,988 | 22,151 | 28,289 | 24,804 | 31,847 | 26,647 | 23,640 | 24,311 | 23,026 | 20,949 | 22,616 | 24,679 |
| 2013 | 23,822 | 24,999 | 31,423 | 24,273 | 27,997 | 26,458 | 24,463 | 26,861 | 23,251 | 23,637 | 22,434 | 22,562 |
| 2014 | 22,753 | 25,299 | 29,685 | 29,061 | 36,611 | 30,945 | 30,833 | 33,088 | 20,530 | 24,959 | 25,609 | 30,125 |
| 2015 | 27,357 | 27,839 | 35,532 | 31,990 | 36,768 | 30,645 | 30,249 | 31,726 | 26,636 | 27,951 | 25,285 | 32,445 |
| 2016 | 22,362 | 29,342 | 32,556 | 32,111 | 34,872 | 30,950 | 31,717 | 30,741 | 32,272 | 29,735 | 28,262 | 31,209 |
| 2017 | 21,567 | 27,161 | 32,707 | 31,104 | 32,937 | 31,051 | 28,333 | 27,644 | 32,769 | 24,667 | 19,287 | 19,969 |
| 2018 | 21,407 | 25,021 | 31,392 | 25,896 | 29,578 | 28,168 | 26,754 | 26,155 | 20,797 | 22,020 | 21,105 | 25,439 |
| 2019 | 25,113 | 29,016 | 24,479 | 19,679 | 25,712 | 28,869 | 30,635 | 30,121 | 20,354 | 22,378 | 24,752 | 23,742 |
| 2020 | 23,477 | 26,590 | 19,147 | 9,245 | 16,063 | 15,079 | 17,564 | 19,154 | 19,894 | 21,569 | 23,987 | 25,409 |
| 2021 | 19,266 | 22,346 | 30,908 | 31,222 | 30,433 | 21,356 | 25,778 | 22,143 | 14,275 | 8,420 | 8,906 | 13,940 |
| 2022 | 15,368 | 15,222 | 16,911 | 24,516 | 25,099 | 19,716 | 18,206 | 17,644 | 18,874 | 16,663 | 16,015 | 17,982 |
| 2023 | 13,049 | 16,398 | 13,528 | 16,729 | 17,308 | 20,485 | 21,382 | 24,134 | 22,679 | 22,272 | 21,005 | 23,400 |
| 2024 | 17,689 | 20,054 | 22,328 | 22,424 | 21,237 | 18,259 | 19,749 | 19,591 | 15,761 | 17,954 | 20,142 | 17,720 |
| 2025 | 17,341 | 16,620 | 21,495 | - | - | - | - | - | - | - | - | - |
| Total | 437,815 | 489,107 | 576,275 | 528,950 | 604,742 | 532,209 | 540,332 | 539,348 | 461,657 | 448,484 | 431,173 | 491,273 |
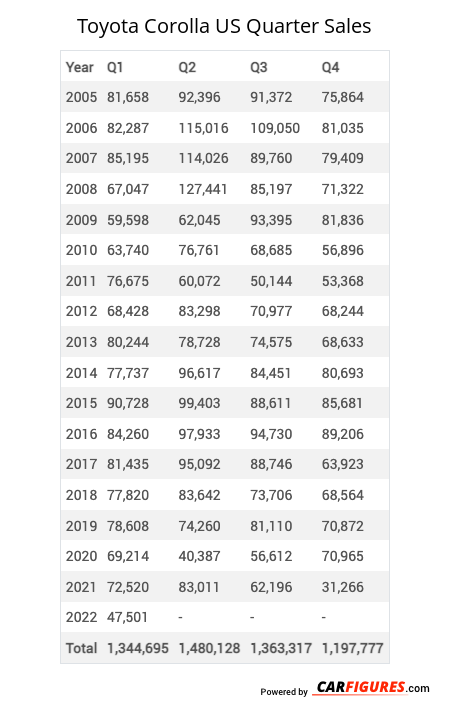
Year | Q1 | Q2 | Q3 | Q4 |
|---|---|---|---|---|
| 2005 | 81,658 | 92,396 | 91,372 | 75,864 |
| 2006 | 82,287 | 115,016 | 109,050 | 81,035 |
| 2007 | 85,195 | 114,026 | 89,760 | 79,409 |
| 2008 | 67,047 | 127,441 | 85,197 | 71,322 |
| 2009 | 59,598 | 62,045 | 93,395 | 81,836 |
| 2010 | 63,740 | 76,761 | 68,685 | 56,896 |
| 2011 | 76,675 | 60,072 | 50,144 | 53,368 |
| 2012 | 68,428 | 83,298 | 70,977 | 68,244 |
| 2013 | 80,244 | 78,728 | 74,575 | 68,633 |
| 2014 | 77,737 | 96,617 | 84,451 | 80,693 |
| 2015 | 90,728 | 99,403 | 88,611 | 85,681 |
| 2016 | 84,260 | 97,933 | 94,730 | 89,206 |
| 2017 | 81,435 | 95,092 | 88,746 | 63,923 |
| 2018 | 77,820 | 83,642 | 73,706 | 68,564 |
| 2019 | 78,608 | 74,260 | 81,110 | 70,872 |
| 2020 | 69,214 | 40,387 | 56,612 | 70,965 |
| 2021 | 72,520 | 83,011 | 62,196 | 31,266 |
| 2022 | 47,501 | 69,331 | 54,724 | 50,660 |
| 2023 | 42,975 | 54,522 | 68,195 | 66,677 |
| 2024 | 60,071 | 61,920 | 55,101 | 55,816 |
| 2025 | 55,456 | - | - | - |
| Total | 1,503,197 | 1,665,901 | 1,541,337 | 1,370,930 |
Year | Sales |
|---|---|
| 2024 | 232,908 |
| 2023 | 232,369 |
| 2022 | 222,216 |
| 2021 | 248,993 |
| 2020 | 237,178 |
| 2019 | 304,850 |
| 2018 | 303,732 |
| 2017 | 329,196 |
| 2016 | 366,129 |
| 2015 | 364,423 |
| 2014 | 339,498 |
| 2013 | 302,180 |
| 2012 | 290,947 |
| 2011 | 240,259 |
| 2010 | 266,082 |
| 2009 | 296,874 |
| 2008 | 351,007 |
| 2007 | 368,390 |
| 2006 | 387,388 |
| 2005 | 341,290 |
| Total | 6,025,909 |
Download Historic Sales Data
Embedded Code
See more widgetsSources: Manufacturers