
Key Stats
How many 4Runner did Toyota sell in 2025?
Toyota sold 8,435 4Runner in 2025. (From Jan - Mar 2025)
How many 4Runner did Toyota sell in March 2025?
Toyota sold 6,980 4Runner in March 2025.
How many 4Runner did Toyota sell in 2024?
Toyota sold 92,156 4Runner in 2024. In 2023, Toyota sold 109,951 4Runner. They sold 17,795 more units in year 2023 compared to 2024 with a percent loss of 16.18% YoY.
Overview
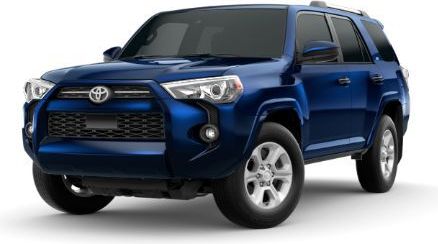
The 2022 Toyota 4Runner is a vehicle from automaker Toyota.
How Much Does the 2022 Toyota 4Runner Cost?
Pricing for the 2022 Toyota 4Runner starts at $37,605 MSRP and goes up to $52,420 fully loaded.
Toyota 4Runner Engine, Transmission, and Performance Numbers
Toyota 4Runner is powered by a 4.0-liter engine with a Rear Wheel Drive powertrain that makes 270 -hp and 278 lb-ft torque. The transmission on the Toyota 4Runner is an 5-Speed ECT Automatic.
List of Toyota 4Runner Competitors
Some of Toyota 4Runner competitors include the Toyota Tacoma, Land Rover Defender and Jeep Grand Cherokee.
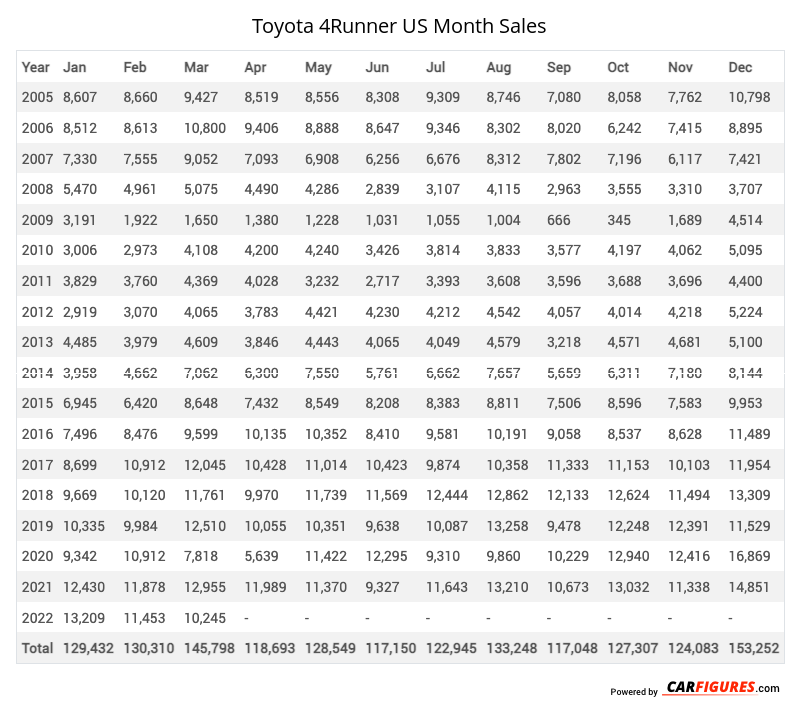
Toyota 4Runner United States Sale figures by year, quarter, and month are presented below. Including the most up to date sales data for the Toyota 4Runner. See how the Toyota 4Runner stacks up the other models in the Crossover/SUVS, Midsize Crossover/SUVs segments.
Year | Jan | Feb | Mar | Apr | May | Jun | Jul | Aug | Sep | Oct | Nov | Dec |
|---|---|---|---|---|---|---|---|---|---|---|---|---|
| 2005 | 8,607 | 8,660 | 9,427 | 8,519 | 8,556 | 8,308 | 9,309 | 8,746 | 7,080 | 8,058 | 7,762 | 10,798 |
| 2006 | 8,512 | 8,613 | 10,800 | 9,406 | 8,888 | 8,647 | 9,346 | 8,302 | 8,020 | 6,242 | 7,415 | 8,895 |
| 2007 | 7,330 | 7,555 | 9,052 | 7,093 | 6,908 | 6,256 | 6,676 | 8,312 | 7,802 | 7,196 | 6,117 | 7,421 |
| 2008 | 5,470 | 4,961 | 5,075 | 4,490 | 4,286 | 2,839 | 3,107 | 4,115 | 2,963 | 3,555 | 3,310 | 3,707 |
| 2009 | 3,191 | 1,922 | 1,650 | 1,380 | 1,228 | 1,031 | 1,055 | 1,004 | 666 | 345 | 1,689 | 4,514 |
| 2010 | 3,006 | 2,973 | 4,108 | 4,200 | 4,240 | 3,426 | 3,814 | 3,833 | 3,577 | 4,197 | 4,062 | 5,095 |
| 2011 | 3,829 | 3,760 | 4,369 | 4,028 | 3,232 | 2,717 | 3,393 | 3,608 | 3,596 | 3,688 | 3,696 | 4,400 |
| 2012 | 2,919 | 3,070 | 4,065 | 3,783 | 4,421 | 4,230 | 4,212 | 4,542 | 4,057 | 4,014 | 4,218 | 5,224 |
| 2013 | 4,485 | 3,979 | 4,609 | 3,846 | 4,443 | 4,065 | 4,049 | 4,579 | 3,218 | 4,571 | 4,681 | 5,100 |
| 2014 | 3,958 | 4,662 | 7,062 | 6,300 | 7,550 | 5,761 | 6,662 | 7,657 | 5,659 | 6,311 | 7,180 | 8,144 |
| 2015 | 6,945 | 6,420 | 8,648 | 7,432 | 8,549 | 8,208 | 8,383 | 8,811 | 7,506 | 8,596 | 7,583 | 9,953 |
| 2016 | 7,496 | 8,476 | 9,599 | 10,135 | 10,352 | 8,410 | 9,581 | 10,191 | 9,058 | 8,537 | 8,628 | 11,489 |
| 2017 | 8,699 | 10,912 | 12,045 | 10,428 | 11,014 | 10,423 | 9,874 | 10,358 | 11,333 | 11,153 | 10,103 | 11,954 |
| 2018 | 9,669 | 10,120 | 11,761 | 9,970 | 11,739 | 11,569 | 12,444 | 12,862 | 12,133 | 12,624 | 11,494 | 13,309 |
| 2019 | 10,335 | 9,984 | 12,510 | 10,055 | 10,351 | 9,638 | 10,087 | 13,258 | 9,478 | 12,248 | 12,391 | 11,529 |
| 2020 | 9,342 | 10,912 | 7,818 | 5,639 | 11,422 | 12,295 | 9,310 | 9,860 | 10,229 | 12,940 | 12,416 | 16,869 |
| 2021 | 12,430 | 11,878 | 12,955 | 11,989 | 11,370 | 9,327 | 11,643 | 13,210 | 10,673 | 13,032 | 11,338 | 14,851 |
| 2022 | 13,209 | 11,453 | 10,245 | 13,228 | 11,198 | 7,496 | 7,682 | 10,066 | 8,842 | 11,333 | 8,980 | 7,291 |
| 2023 | 7,945 | 5,684 | 7,487 | 10,354 | 9,979 | 0 | 11,206 | 12,569 | 12,083 | 10,344 | 10,025 | 12,275 |
| 2024 | 10,104 | 10,963 | 12,756 | 11,932 | 11,265 | 9,530 | 7,627 | 9,269 | 5,745 | 2,606 | 299 | 60 |
| 2025 | 160 | 1,295 | 6,980 | - | - | - | - | - | - | - | - | - |
| Total | 147,641 | 148,252 | 173,021 | 154,207 | 160,991 | 134,176 | 149,460 | 165,152 | 143,718 | 151,590 | 143,387 | 172,878 |
Year | Q1 | Q2 | Q3 | Q4 |
|---|---|---|---|---|
| 2005 | 26,694 | 25,383 | 25,135 | 26,618 |
| 2006 | 27,925 | 26,941 | 25,668 | 22,552 |
| 2007 | 23,937 | 20,257 | 22,790 | 20,734 |
| 2008 | 15,506 | 11,615 | 10,185 | 10,572 |
| 2009 | 6,763 | 3,639 | 2,725 | 6,548 |
| 2010 | 10,087 | 11,866 | 11,224 | 13,354 |
| 2011 | 11,958 | 9,977 | 10,597 | 11,784 |
| 2012 | 10,054 | 12,434 | 12,811 | 13,456 |
| 2013 | 13,073 | 12,354 | 11,846 | 14,352 |
| 2014 | 15,682 | 19,611 | 19,978 | 21,635 |
| 2015 | 22,013 | 24,189 | 24,700 | 26,132 |
| 2016 | 25,571 | 28,897 | 28,830 | 28,654 |
| 2017 | 31,656 | 31,865 | 31,565 | 33,210 |
| 2018 | 31,550 | 33,278 | 37,439 | 37,427 |
| 2019 | 32,829 | 30,044 | 32,823 | 36,168 |
| 2020 | 28,072 | 29,356 | 29,399 | 42,225 |
| 2021 | 37,263 | 32,686 | 35,526 | 39,221 |
| 2022 | 34,907 | 31,922 | 26,590 | 27,604 |
| 2023 | 21,116 | 20,333 | 35,858 | 32,644 |
| 2024 | 33,823 | 32,727 | 22,641 | 2,965 |
| 2025 | 8,435 | - | - | - |
| Total | 468,914 | 449,374 | 458,330 | 467,855 |
Year | Sales |
|---|---|
| 2024 | 92,156 |
| 2023 | 109,951 |
| 2022 | 121,023 |
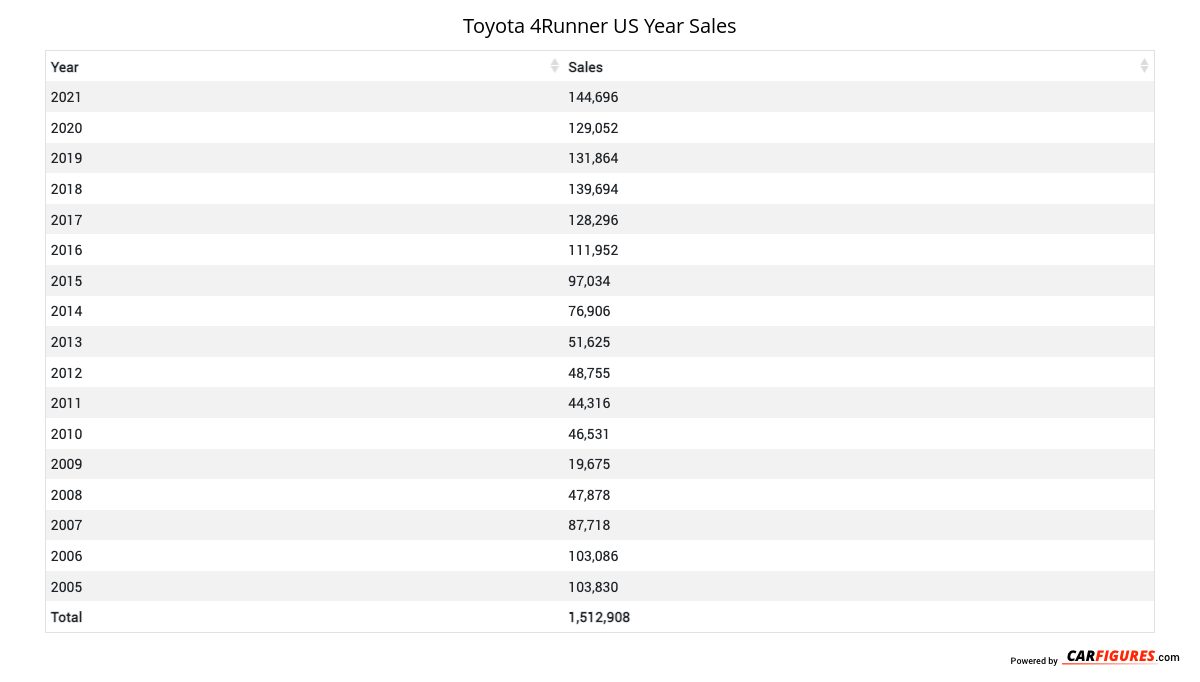
| 2021 | 144,696 |
| 2020 | 129,052 |
| 2019 | 131,864 |
| 2018 | 139,694 |
| 2017 | 128,296 |
| 2016 | 111,952 |
| 2015 | 97,034 |
| 2014 | 76,906 |
| 2013 | 51,625 |
| 2012 | 48,755 |
| 2011 | 44,316 |
| 2010 | 46,531 |
| 2009 | 19,675 |
| 2008 | 47,878 |
| 2007 | 87,718 |
| 2006 | 103,086 |
| 2005 | 103,830 |
| Total | 1,836,038 |
Download Historic Sales Data

Embedded Code
See more widgetsSources: Manufacturers