Key Stats
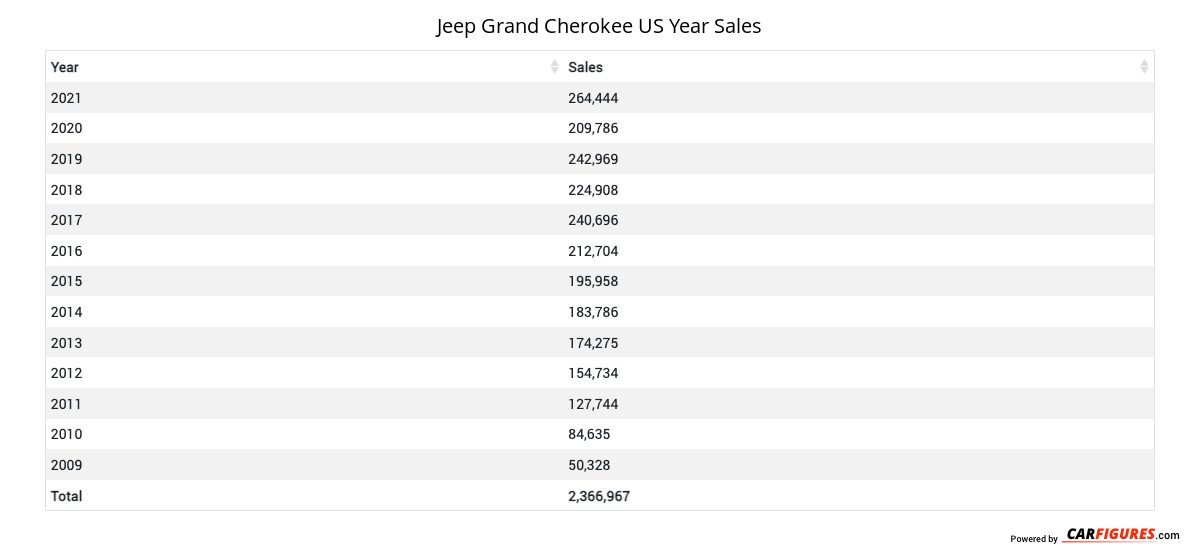
How many Grand Cherokee did Jeep sell in 2024?
Jeep sold 106,483 Grand Cherokee in 2024. In 2023, Jeep sold 124,957 Grand Cherokee. They sold 18,474 more units in year 2023 compared to 2024 with a percent loss of 14.78% YoY.
Overview
The 2022 Jeep Grand Cherokee is a vehicle from automaker Jeep.
How Much Does the 2022 Jeep Grand Cherokee Cost?
The 2022 Jeep Grand Cherokee starts at $37,390 MSRP. Fully loaded, the Jeep Grand Cherokee will cost you about $59,365.
Jeep Grand Cherokee Engine, Transmission, and Performance Numbers
Jeep Grand Cherokee is powered by a 3.6-liter engine with a Rear Wheel Drive powertrain that makes 293 -hp and 257 lb-ft torque. The transmission on the Jeep Grand Cherokee is an 8-Speed Automatic 850RE (STD).
List of Jeep Grand Cherokee Competitors
Some of Jeep Grand Cherokee competitors include the Honda Passport, Toyota 4Runner and Subaru Outback.
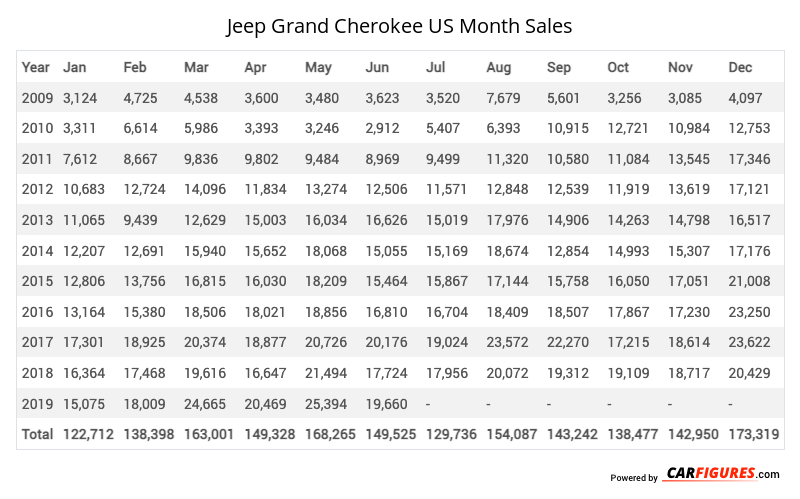
Jeep Grand Cherokee United States Sale figures by year, quarter, and month are presented below. Including the most up to date sales data for the Jeep Grand Cherokee. See how the Jeep Grand Cherokee stacks up the other models in the Crossover/SUVS, Midsize Crossover/SUVs segments.
Year | Jan | Feb | Mar | Apr | May | Jun | Jul | Aug | Sep | Oct | Nov | Dec |
|---|---|---|---|---|---|---|---|---|---|---|---|---|
| 2009 | 3,124 | 4,725 | 4,538 | 3,600 | 3,480 | 3,623 | 3,520 | 7,679 | 5,601 | 3,256 | 3,085 | 4,097 |
| 2010 | 3,311 | 6,614 | 5,986 | 3,393 | 3,246 | 2,912 | 5,407 | 6,393 | 10,915 | 12,721 | 10,984 | 12,753 |
| 2011 | 7,612 | 8,667 | 9,836 | 9,802 | 9,484 | 8,969 | 9,499 | 11,320 | 10,580 | 11,084 | 13,545 | 17,346 |
| 2012 | 10,683 | 12,724 | 14,096 | 11,834 | 13,274 | 12,506 | 11,571 | 12,848 | 12,539 | 11,919 | 13,619 | 17,121 |
| 2013 | 11,065 | 9,439 | 12,629 | 15,003 | 16,034 | 16,626 | 15,019 | 17,976 | 14,906 | 14,263 | 14,798 | 16,517 |
| 2014 | 12,207 | 12,691 | 15,940 | 15,652 | 18,068 | 15,055 | 15,169 | 18,674 | 12,854 | 14,993 | 15,307 | 17,176 |
| 2015 | 12,806 | 13,756 | 16,815 | 16,030 | 18,209 | 15,464 | 15,867 | 17,144 | 15,758 | 16,050 | 17,051 | 21,008 |
| 2016 | 13,164 | 15,380 | 18,506 | 18,021 | 18,856 | 16,810 | 16,704 | 18,409 | 18,507 | 17,867 | 17,230 | 23,250 |
| 2017 | 17,301 | 18,925 | 20,374 | 18,877 | 20,726 | 20,176 | 19,024 | 23,572 | 22,270 | 17,215 | 18,614 | 23,622 |
| 2018 | 16,364 | 17,468 | 19,616 | 16,647 | 21,494 | 17,724 | 17,956 | 20,072 | 19,312 | 19,109 | 18,717 | 20,429 |
| 2019 | 15,075 | 18,009 | 24,665 | 20,469 | 25,394 | 19,660 | - | - | - | - | - | - |
| Total | 122,712 | 138,398 | 163,001 | 149,328 | 168,265 | 149,525 | 129,736 | 154,087 | 143,242 | 138,477 | 142,950 | 173,319 |
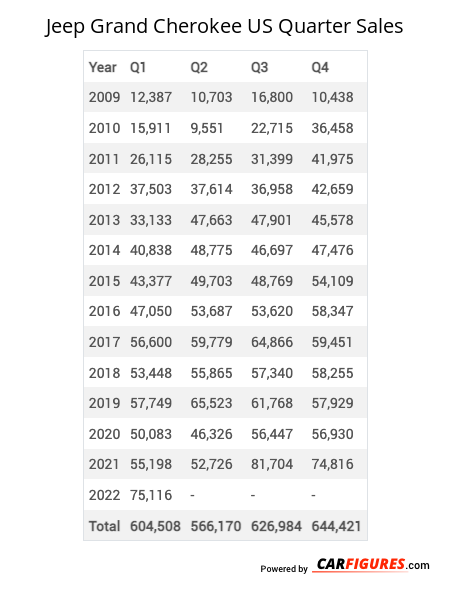
Year | Q1 | Q2 | Q3 | Q4 |
|---|---|---|---|---|
| 2009 | 12,387 | 10,703 | 16,800 | 10,438 |
| 2010 | 15,911 | 9,551 | 22,715 | 36,458 |
| 2011 | 26,115 | 28,255 | 31,399 | 41,975 |
| 2012 | 37,503 | 37,614 | 36,958 | 42,659 |
| 2013 | 33,133 | 47,663 | 47,901 | 45,578 |
| 2014 | 40,838 | 48,775 | 46,697 | 47,476 |
| 2015 | 43,377 | 49,703 | 48,769 | 54,109 |
| 2016 | 47,050 | 53,687 | 53,620 | 58,347 |
| 2017 | 56,600 | 59,779 | 64,866 | 59,451 |
| 2018 | 53,448 | 55,865 | 57,340 | 58,255 |
| 2019 | 57,749 | 65,523 | 61,768 | 57,929 |
| 2020 | 50,083 | 46,326 | 56,447 | 56,930 |
| 2021 | 55,198 | 52,726 | 81,704 | 74,816 |
| 2022 | 75,116 | 59,253 | 38,175 | 50,800 |
| 2023 | 54,502 | 70,455 | 0 | 0 |
| 2024 | 0 | 52,295 | 54,188 | 0 |
| 2025 | - | - | - | - |
| Total | 659,010 | 748,173 | 719,347 | 695,221 |
Year | Sales |
|---|---|
| 2024 | 106,483 |
| 2023 | 124,957 |
| 2022 | 223,344 |
| 2021 | 264,444 |
| 2020 | 209,786 |
| 2019 | 242,969 |
| 2018 | 224,908 |
| 2017 | 240,696 |
| 2016 | 212,704 |
| 2015 | 195,958 |
| 2014 | 183,786 |
| 2013 | 174,275 |
| 2012 | 154,734 |
| 2011 | 127,744 |
| 2010 | 84,635 |
| 2009 | 50,328 |
| Total | 2,821,751 |
Download Historic Sales Data
Embedded Code
See more widgetsSources: Manufacturers