Key Stats
How many Murano did Nissan sell in 2024?
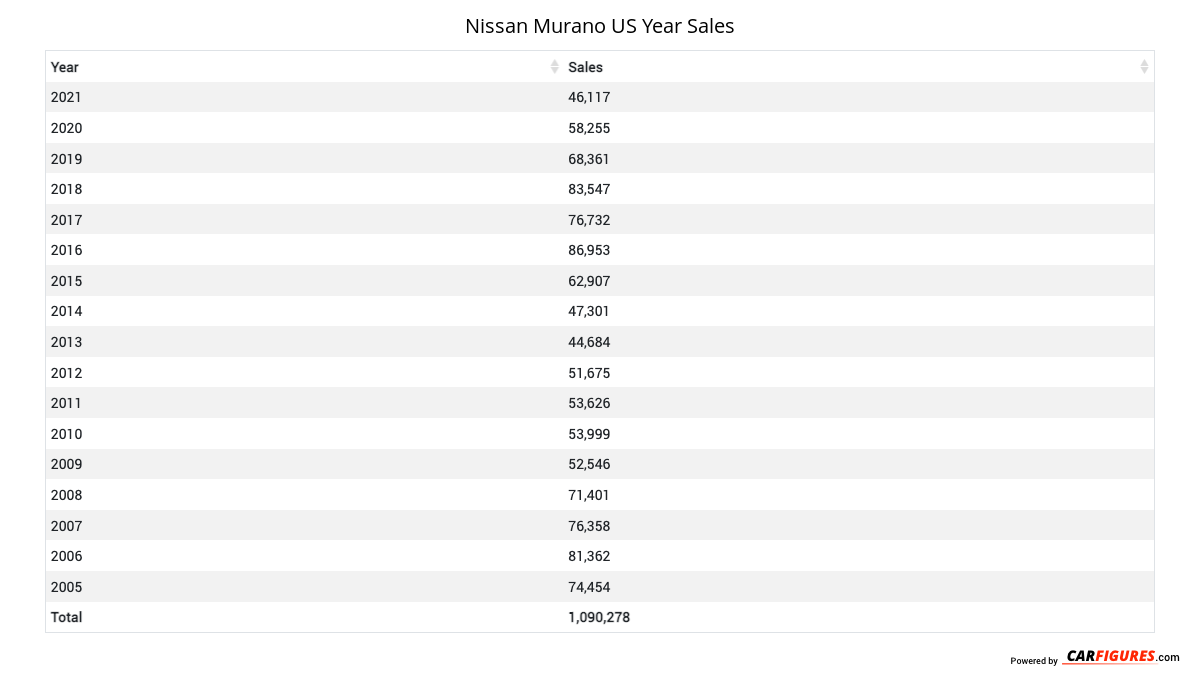
Nissan sold 14,438 Murano in 2024. In 2023, Nissan sold 27,660 Murano. They sold 13,222 more units in year 2023 compared to 2024 with a percent loss of 47.8% YoY.
Overview
The 2022 Nissan Murano is a vehicle from automaker Nissan.
How Much Does the 2022 Nissan Murano Cost?
Pricing for the 2022 Nissan Murano starts at $32,910 MSRP and goes up to $46,160 fully loaded.
Nissan Murano Engine, Transmission, and Performance Numbers
Nissan Murano is powered by a 3.5-liter engine with a Front Wheel Drive powertrain that makes 260 -hp and 240 lb-ft torque. The transmission on the Nissan Murano is an Xtronic Continuously Variable (CVT).
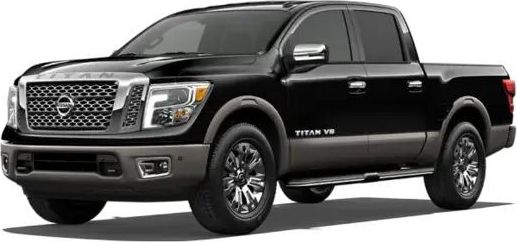
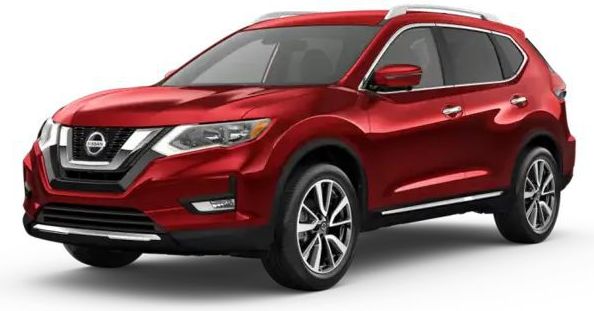
List of Nissan Murano Competitors
Some of Nissan Murano competitors include the Nissan Rogue, Ford Edge and Chevrolet Blazer.
Nissan Murano United States Sale figures by year, quarter, and month are presented below. Including the most up to date sales data for the Nissan Murano. See how the Nissan Murano stacks up the other models in the Crossover/SUVS, Midsize Crossover/SUVs segments.
Year | Jan | Feb | Mar | Apr | May | Jun | Jul | Aug | Sep | Oct | Nov | Dec |
|---|---|---|---|---|---|---|---|---|---|---|---|---|
| 2005 | 5,436 | 5,743 | 7,131 | 6,142 | 6,188 | 6,449 | 7,550 | 5,935 | 5,306 | 4,534 | 5,764 | 8,276 |
| 2006 | 6,988 | 7,421 | 8,787 | 6,879 | 6,662 | 6,617 | 6,603 | 6,440 | 6,093 | 6,440 | 5,601 | 6,831 |
| 2007 | 6,495 | 8,100 | 11,822 | 6,316 | 6,473 | 5,869 | 5,793 | 6,580 | 5,777 | 4,958 | 3,976 | 4,199 |
| 2008 | 5,689 | 10,074 | 9,710 | 5,737 | 6,121 | 4,443 | 4,765 | 5,071 | 4,866 | 4,302 | 4,162 | 6,461 |
| 2009 | 5,204 | 4,126 | 5,815 | 3,567 | 5,088 | 3,212 | 3,457 | 4,534 | 4,236 | 3,881 | 3,924 | 5,502 |
| 2010 | 3,648 | 4,056 | 5,490 | 4,026 | 4,944 | 3,515 | 5,462 | 5,153 | 4,509 | 3,968 | 4,399 | 4,829 |
| 2011 | 3,578 | 5,254 | 5,682 | 3,329 | 3,384 | 3,435 | 4,414 | 5,121 | 4,481 | 4,600 | 4,875 | 5,473 |
| 2012 | 3,895 | 5,045 | 6,203 | 3,009 | 4,550 | 4,477 | 4,363 | 4,095 | 3,685 | 3,225 | 5,129 | 3,999 |
| 2013 | 2,996 | 3,987 | 4,870 | 2,404 | 3,152 | 3,178 | 3,787 | 3,925 | 2,879 | 3,102 | 5,720 | 4,684 |
| 2014 | 2,188 | 3,889 | 5,296 | 2,384 | 3,610 | 3,058 | 4,640 | 5,594 | 4,164 | 4,271 | 3,840 | 4,367 |
| 2015 | 3,773 | 4,005 | 5,547 | 4,121 | 5,715 | 5,314 | 5,459 | 5,800 | 5,166 | 5,350 | 5,574 | 7,083 |
| 2016 | 5,516 | 7,445 | 8,657 | 6,232 | 5,978 | 5,665 | 6,271 | 7,482 | 7,536 | 10,701 | 7,589 | 7,881 |
| 2017 | 4,363 | 5,569 | 7,317 | 5,504 | 6,409 | 5,534 | 6,314 | 4,895 | 7,002 | 5,714 | 8,393 | 9,718 |
| 2018 | 6,792 | 6,179 | 7,751 | 3,391 | 5,881 | 8,806 | 6,549 | 9,619 | 8,257 | 5,737 | 6,552 | 8,033 |
| 2019 | 4,080 | 3,412 | 4,237 | 3,476 | 5,634 | 5,133 | 6,454 | 9,462 | 8,460 | 7,477 | 5,349 | 5,187 |
| Total | 70,641 | 84,305 | 104,315 | 66,517 | 79,789 | 74,705 | 81,881 | 89,706 | 82,417 | 78,260 | 80,847 | 92,523 |
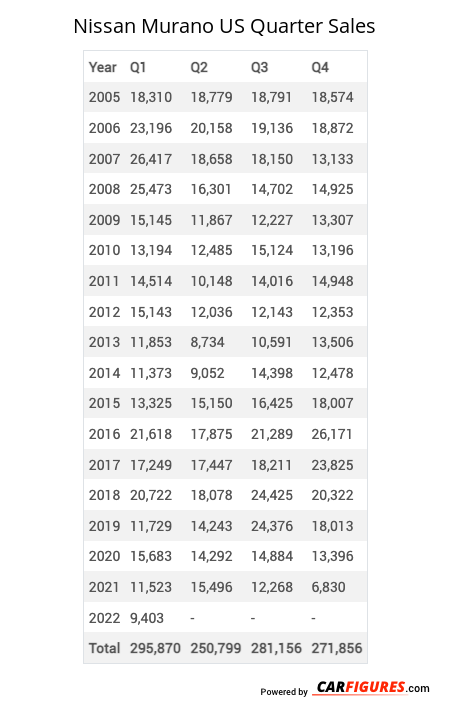
Year | Q1 | Q2 | Q3 | Q4 |
|---|---|---|---|---|
| 2005 | 18,310 | 18,779 | 18,791 | 18,574 |
| 2006 | 23,196 | 20,158 | 19,136 | 18,872 |
| 2007 | 26,417 | 18,658 | 18,150 | 13,133 |
| 2008 | 25,473 | 16,301 | 14,702 | 14,925 |
| 2009 | 15,145 | 11,867 | 12,227 | 13,307 |
| 2010 | 13,194 | 12,485 | 15,124 | 13,196 |
| 2011 | 14,514 | 10,148 | 14,016 | 14,948 |
| 2012 | 15,143 | 12,036 | 12,143 | 12,353 |
| 2013 | 11,853 | 8,734 | 10,591 | 13,506 |
| 2014 | 11,373 | 9,052 | 14,398 | 12,478 |
| 2015 | 13,325 | 15,150 | 16,425 | 18,007 |
| 2016 | 21,618 | 17,875 | 21,289 | 26,171 |
| 2017 | 17,249 | 17,447 | 18,211 | 23,825 |
| 2018 | 20,722 | 18,078 | 24,425 | 20,322 |
| 2019 | 11,729 | 14,243 | 24,376 | 18,013 |
| 2020 | 15,683 | 14,292 | 14,884 | 13,396 |
| 2021 | 11,523 | 15,496 | 12,268 | 6,830 |
| 2022 | 9,403 | 7,396 | 5,578 | 7,697 |
| 2023 | 12,444 | 8,745 | 1,640 | 4,831 |
| 2024 | 4,727 | 4,413 | 5,298 | 0 |
| 2025 | - | - | - | - |
| Total | 313,041 | 271,353 | 293,672 | 284,384 |
Year | Sales |
|---|---|
| 2024 | 14,438 |
| 2023 | 27,660 |
| 2022 | 30,074 |
| 2021 | 46,117 |
| 2020 | 58,255 |
| 2019 | 68,361 |
| 2018 | 83,547 |
| 2017 | 76,732 |
| 2016 | 86,953 |
| 2015 | 62,907 |
| 2014 | 47,301 |
| 2013 | 44,684 |
| 2012 | 51,675 |
| 2011 | 53,626 |
| 2010 | 53,999 |
| 2009 | 52,546 |
| 2008 | 71,401 |
| 2007 | 76,358 |
| 2006 | 81,362 |
| 2005 | 74,454 |
| Total | 1,162,450 |
Download Historic Sales Data

Embedded Code
See more widgetsSources: Manufacturers